
The framework is almost never the problem
The console that gets handed to us has a familiar shape. One table with tens of thousands of rows, four or five filter controls above it, a pair of time-series charts, a detail drawer, and a team that has already rewritten the state management twice without moving the number. The working theory is usually that the framework is too slow. It usually is not. React, Vue, Svelte and Angular all render two hundred rows without complaint, and none of them render fifty thousand without help, because the cost lives in how many DOM nodes exist, how often you touch them, and how much JSON the browser had to parse on the main thread before anything appeared at all.
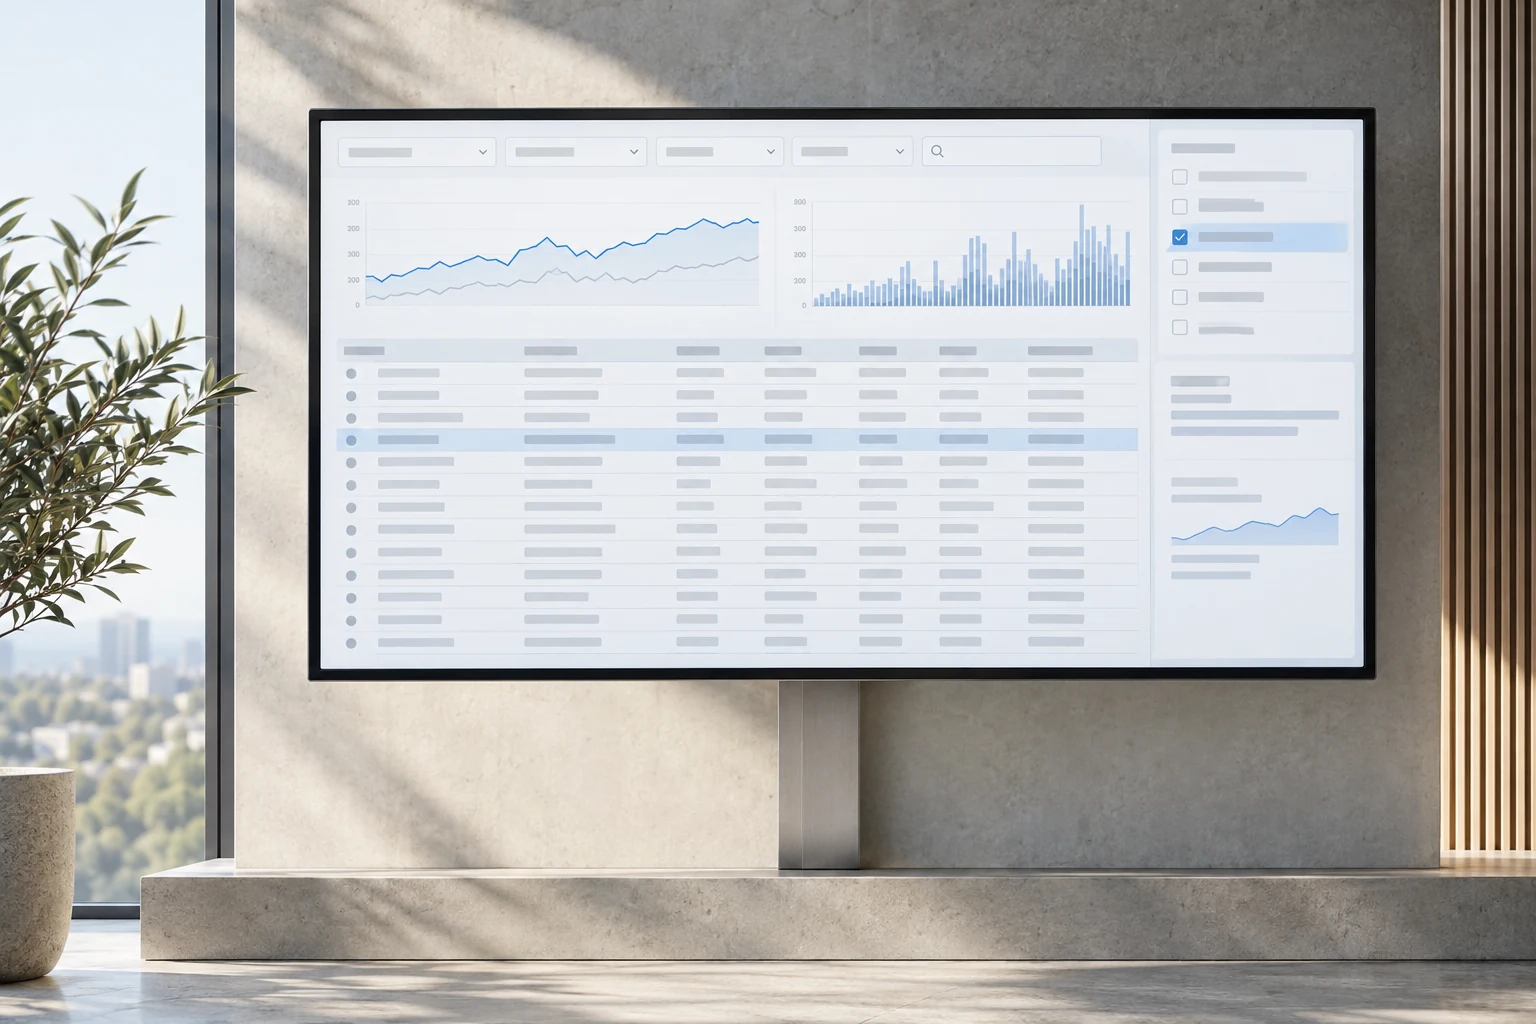

Data-heavy applications fail in five places and they fail in about the same order every time. The response is larger than it needs to be. Parsing it blocks the main thread. Far more nodes get created than the screen can show. Too much of the component tree re-renders on every interaction. And the charts are handed more points than the canvas has pixels to draw. Bundle size, hydration strategy and the choice of state library are all real topics, and all of them are downstream of those five.
This article is about internal-facing software: analytics consoles, admin tools, observability dashboards, order blotters, claims queues, anything where a person's job is to look at a large result set and act on it. Those apps have a specific profile. They live behind a login, they are used all day by the same people, and the perceived speed comes from interaction latency rather than first load. Optimizing them like a marketing page produces a fast landing screen attached to a filter that takes two seconds to respond.
You are probably here because
- The request comes back in eighty milliseconds and the screen still does nothing for another second.
- Typing in a filter feels like the input is dropping characters, and then the whole list catches up at once.
- It is fast on your laptop and slow for the one customer with forty times more rows than everyone else.
- The dashboard was fine until somebody widened the default date range.
Those are four faces of one root cause: the app is doing work proportional to the size of the data rather than the size of the screen. The next section, on measuring the interaction instead of the page, tells you which term is dominating yours, and the symptom table further down names the first fix for each.
Measure the interaction, not the page
Start with the numbers the platform already defines. Largest Contentful Paint has a good threshold at 2.5 seconds, Cumulative Layout Shift at 0.1, and Interaction to Next Paint at 200 milliseconds, all evaluated at the 75th percentile of real sessions. INP replaced First Input Delay as a Core Web Vital in March 2024, and for this class of app that change is the whole story. A console is almost entirely interaction after the first load. First Input Delay measured only the queueing time before the handler ran, which flattered exactly the applications that spend 400 milliseconds inside the handler and another 300 in the render that follows.
Then instrument the thing your users actually complain about. The most useful number we collect on these projects is the time from a filter change to the first painted row, bucketed by result-set size, because that single measurement contains the query, the transfer, the parse, the state update, the render and the paint. Track it at p75 and p95, split by the size of the customer's data, and you will find that the mean was hiding a tenant with forty times more rows than everyone else.
Collection is straightforward. A PerformanceObserver on the event entry type gives per-interaction durations. The longtask entry type reports any main-thread task over 50 milliseconds, and Long Animation Frames, available in Chromium, attributes the blocking script back to a source file, which is what you actually need. Google's web-vitals library packages the field metrics into three callbacks. Wrap the expensive parts of your own code in performance.mark and performance.measure so the traces have your vocabulary in them rather than a wall of anonymous frames.
Your laptop is not the device, and your login is not the field
Development machines are two to five times faster than the hardware most business users have, and they sit next to the server. Profile with CPU throttling on, at four or six times slowdown, and with network throttling that reflects a busy office connection rather than localhost. And note that an authenticated internal tool never appears in the Chrome UX Report, so there is no public field dataset to fall back on. If you do not instrument it yourself, you have no field data at all, only opinions collected in meetings.
Impact by lever — where we start before a profile exists
A ranking, not a measurement. It is the order we work in when there is no profile yet, and the profile replaces it on day one.
Never ship a row you are not going to draw
The largest wins are almost always subtractive, and they happen on the server. Project only the columns the grid displays instead of selecting everything and letting the client ignore three quarters of it. Push filtering, sorting and aggregation into the database, where an index can answer the question, rather than shipping the raw set so the browser can sort it. And paginate on a key rather than an offset. OFFSET 200000 makes the database walk and discard two hundred thousand rows before returning anything, and the cost grows the deeper the user scrolls. A keyset predicate on the sort column plus a tiebreaker returns page five hundred as quickly as page one.
Then look at the shape of what remains. An array of objects repeats every key name on every row, so ten thousand rows with twelve fields carries a hundred and twenty thousand copies of the same twelve strings. Compression hides most of that on the wire, and hides none of the parse and allocation cost on the client. An array of arrays plus a separate header list is uglier to read and materially cheaper to parse. Send numbers as numbers rather than strings. Send timestamps in one format, decided once, rather than pre-formatted per locale on the server.
JSON.parse is synchronous, main-thread, and roughly proportional to input size. That is the part people miss when they benchmark the API and declare the backend fast. The request finished in 80 milliseconds and then the browser stopped for the length of the parse before a single pixel changed. Put performance.now() either side of the parse in your own code and read the number on throttled hardware. If it is meaningful, the payload is too big, or the parse belongs in a worker, or both.
Two structural options are worth knowing. Streaming the response as newline-delimited JSON over a ReadableStream lets you paint the first fifty rows while the rest is still arriving, which changes perceived speed more than any micro-optimization in the render path. And for genuinely columnar analytical payloads, Apache Arrow's IPC format gives you typed arrays instead of objects, transfers into a worker without a copy, and pairs with DuckDB-Wasm when the user pivots repeatedly over the same slice. Neither is a default. Both are the right answer once the payload is large and the shape is regular.
Rendering strategy is a function of scale
Fifty thousand rows by twelve columns is six hundred thousand cells, before wrappers, before the icon in the status column, before the checkbox. A browser will sometimes hold that in memory. It will not do style, layout and paint over it at interactive speed, and every hover state you add multiplies the work. Pick the strategy from the row count instead of adopting one everywhere.
| Scale | What works | What it costs you |
|---|---|---|
| Under 200 rows | Plain DOM, no windowing, no memoization theatre | Nothing. Do not add machinery you do not need |
| 200 to 2,000 rows | Plain DOM with stable keys, plus content-visibility: auto and contain-intrinsic-size on rows | Scroll-anchoring quirks if the intrinsic size is wrong |
| 2,000 to 50,000 rows | Windowing with a virtualizer such as react-window or TanStack Virtual, fixed row height where possible | Find-in-page stops working, screen readers need explicit row indexing, export needs its own path |
| 50,000+ rows or 30+ columns | Canvas-rendered grid, horizontal virtualization as well as vertical | You rebuild selection, focus, text selection, IME and accessibility yourself |
| Live streaming updates | Windowing plus batched state writes, one per animation frame | Ordering and dedup logic moves into your buffer |
| Aggregates over millions of rows | Do not ship rows at all. Aggregate server-side and send the summary | Drill-down becomes a second request, which is usually correct anyway |
Windowing is the workhorse and it deserves its caveats stated plainly, because they surface late and expensively. Ctrl-F stops finding rows that are not in the DOM, and users of internal tools rely on Ctrl-F more than any designer expects. Screen readers need aria-rowcount and aria-rowindex to describe a list whose DOM is a lie about its true length. Keyboard navigation has to survive rows unmounting under the focused element. Printing and CSV export must run off the data, not off the rendered table. None of that is hard, and all of it is work that a "just add virtualization" ticket does not contain.
Fixed row height is worth fighting for. Variable heights force a measurement cache, and a measurement cache produces scroll-position jumps whenever an estimate turns out wrong. If the design calls for expandable rows, keep the collapsed height fixed and treat the expanded row as a separate item in the list rather than a variable-height row.
Re-render fan-out is the cost nobody profiles
Here is the pattern we find most often. The filter text lives in a context provider near the root of the tree. Every keystroke updates it. Every consumer of that context re-renders, which is the table, the toolbar, the chart panel and the detail drawer. Forty visible rows times twelve cells is 480 component renders per character typed, plus whatever the charts do. Each individual render is cheap. The product is not, and it lands inside the interaction window where the user is waiting.
The fixes are ordinary and they compose. Keep transient state local to the component that owns it, and publish only the committed value upward, on debounce or on blur. Use a store with selector subscriptions, whether that is useSyncExternalStore directly, Zustand, or Redux with memoized selectors, so a component subscribes to the slice it reads instead of an object that is new on every update. Split one wide context into several narrow ones when consumers genuinely need different parts of it.
Understand what memoization does and does not do. React.memo compares props by reference, so passing an inline arrow function or an object literal defeats it completely and silently. If a row component receives onSelect={() => select(id)}, it re-renders every time regardless of the memo wrapper. Stabilize the callback, or pass the id and hoist the handler to the list. Prefer passing primitives into leaf cells rather than a row object your map rebuilds each pass.
For work that genuinely has to happen, use the scheduling primitives instead of trying to make it faster. useDeferredValue keeps the input responsive while the expensive list catches up with the last committed value. startTransition marks a state update as interruptible, so a keystroke can preempt a large re-render already in flight. And for live data, coalesce. A blotter receiving five hundred messages per second does not need five hundred renders per second. Buffer into an array, flush once per animation frame, and the render count drops by an order of magnitude with no visible difference to the user.
Allocating a 200 ms interaction budget
A budget, not a measurement. Divide the 200 ms target before you optimize, so an overrun has an owner instead of an argument.
Charts: you cannot draw more points than you have pixels
SVG charting libraries create a node per point. Three series of twenty thousand samples is sixty thousand nodes in a chart that is nine hundred pixels wide, which means the browser is doing layout on roughly sixty-six nodes for every column of pixels it will eventually rasterize into one line. Hover handling then scans that set on every mouse move. This is the single most common reason a dashboard is fine until someone widens the date range.
The arithmetic settles the design. A nine-hundred-pixel plot area can show about eighteen hundred meaningful values if you plot a minimum and a maximum per pixel column. Anything beyond that is transmitted, parsed, laid out and then discarded by the rasterizer. So decide where the reduction happens, and do it as far upstream as you can. Time-bucketing in the database, with the bucket width derived from the requested range and the chart width, is the cheapest place. The client should be asking for a series sized to the chart, not for the raw table.
When you do reduce on the client, pick the method deliberately. Taking every nth point is fast and loses exactly the spikes an operator is looking for. Averaging into buckets smooths anomalies out of existence, which is worse than dropping them because it looks correct. Largest-Triangle-Three-Buckets, from Sveinn Steinarsson's 2013 work on downsampling time series for visual representation, preserves the visual shape far better at the same point count and is a short function to implement. For anomaly-hunting views, keep the minimum and maximum of each bucket and draw the pair, so a one-sample spike survives the reduction.
Rendering target matters as much as point count. uPlot draws dense time series to canvas and stays responsive at point counts where an SVG library has already given up. ECharts has a canvas renderer and its own progressive rendering mode. Chart.js ships a decimation plugin. If you need scatter plots with hundreds of thousands of marks, that is WebGL territory. And whatever you use, index the points for hit testing, with a bucket lookup or a quadtree, rather than scanning the series on every mousemove.
Get the heavy work off the main thread
The main thread paints. Everything you leave on it competes with the frame the user is waiting for. Fetching, parsing, filtering, sorting and aggregating can all live in a Web Worker, and the pattern that pays is to move the whole chain rather than one step of it. Fetch inside the worker, parse inside the worker, compute the aggregate inside the worker, and post back only the few hundred rows and the summary numbers the screen will show.
The trap is the handoff. postMessage uses structured clone by default, which copies, and copying a large object graph can cost as much as the work you moved. Transferables avoid it: an ArrayBuffer moves rather than copies, which is why typed arrays and Arrow buffers make worker architectures worth building. Comlink removes most of the message-plumbing boilerplate if you want a promise-based call interface instead. SharedArrayBuffer is available only under cross-origin isolation, which means COOP and COEP headers, which in turn breaks third-party embeds that are not configured for it. Decide that early or not at all.
Some work has to stay on the main thread because it touches the DOM. For that, yield. Splitting one 400-millisecond task into eight 50-millisecond chunks does not reduce total work by a microsecond, and it improves INP substantially, because the browser gets to paint and to run the pending input handler between chunks. scheduler.yield() where it is available, requestIdleCallback for genuinely deferrable work, and a plain await on a macrotask as the portable fallback all do the job. OffscreenCanvas extends the same idea to drawing, letting a worker render the chart surface directly.
Waterfalls, cancellation, and the bug that looks like flakiness
Component-level data fetching creates request waterfalls by construction. The parent fetches, renders, and only then does the child discover it needs data of its own, so two round trips happen in sequence when one would have done. Hoisting fetches to a route-level loader, or prefetching a child's query as soon as the parent's key is known, removes the second trip. The equivalent inside a list is worse: a row component that fetches its own detail turns one screen into forty requests. HTTP/2 multiplexing removed the six-connections-per-origin ceiling that made this catastrophic, and it did not make the round trips free.
Attach an AbortController to every request keyed by a filter, and abort the previous one when the filter changes. Without it you have a race, and the race produces a bug that reads as flakiness in a ticket: a user narrows a filter, the slow first response lands after the fast second, and the table shows results for a query that is no longer on screen. It reproduces about one time in twenty, always on a slow connection, and it is nobody's fault in the code review because each individual fetch is correct.
A request cache with stale-while-revalidate semantics, TanStack Query or SWR, is close to mandatory for this class of app, and it needs its defaults reviewed. Data marked stale immediately will refetch on every window focus, which in a workflow where people tab between the console and a spreadsheet means a refetch storm nobody asked for. Set staleTime per query from how fast the underlying data actually changes. Prefetch on intent, when the pointer enters a row or the row takes focus, so the detail drawer opens against a warm cache. And use cursor-based pagination for infinite scroll, because offset paging duplicates and skips rows whenever the underlying set shifts while a user is scrolling.
Send it over and we will tell you what we would change.
Email a DevTools performance trace of the interaction that feels slow, recorded with CPU throttling on, plus one sample API response for that screen and the row and column counts of the table, to contact@precisionfederal.com. You get back a short written note naming the three things we would change and why. One business day. No charge, no meeting, no deck.
contact@precisionfederal.comThe cost hiding inside a single cell
Once the structural work is done, the profile tends to point somewhere unglamorous. The most common single finding in grid code is a formatter constructed per cell per render. new Intl.NumberFormat(locale, opts) and new Intl.DateTimeFormat(locale, opts) are not cheap to construct, and toLocaleString is the same constructor wearing a friendlier name. Build one formatter per column, at module scope or in a memo, and reuse it. On a grid drawing thousands of cells per scroll, this alone can move the frame time into budget.
Listeners. A handler attached to every cell is thousands of listeners the browser has to manage and your code has to tear down. Delegate at the table container and resolve the target from a data attribute. The same applies to tooltips: mount one tooltip and move it, rather than mounting a portal per cell on hover.
Paint. Box shadows, blurs, backdrop filters and border radii are inexpensive on a card and expensive on ten thousand rows, because paint cost scales with the number of painted elements and the area each one dirties. Apply contain: layout paint style to the row so a change inside it cannot invalidate layout for the whole table.
Forced synchronous layout. Reading offsetHeight or getBoundingClientRect inside a loop that also writes styles makes the browser recompute layout on every iteration. DevTools flags it as a forced reflow, and it is usually a measurement pass in a virtualizer or a sticky-header calculation. Batch every read, then every write, or move the measurement to a ResizeObserver.
Keys. Using an array index as a React key on a sortable, filterable list means every reorder looks like a content change for every row. Use the record id. It is a one-line change with an outsized effect on reconciliation.
| Symptom | Usual cause | First fix to try |
|---|---|---|
| Typing in a filter feels laggy | Filter state high in the tree, list re-rendering per keystroke | Local input state plus useDeferredValue, selector subscriptions on the list |
| Long freeze after the request returns | Main-thread JSON.parse and a synchronous transform over the whole set | Smaller payload, then parse and transform in a worker |
| Scrolling stutters, memory climbs | Every row in the DOM, per-cell listeners, heavy paint properties | Windowing, event delegation, contain on rows |
| Fine until the date range widens | Chart receiving raw points and rendering a node per point | Bucket server-side to about twice the chart width, canvas renderer |
| Results occasionally match the wrong filter | No request cancellation, out-of-order responses | AbortController per key, or a request cache that discards stale results |
| Fast for you, slow for the biggest customer | Measurement at the mean, on unthrottled hardware, on a small tenant | p75 and p95 by result-set size, with CPU throttling on |
Six ways teams make a slow console slower
- Rewriting the state layer first. It is the most visible change available and it moves the interaction number least. Profile before you migrate anything.
- Adding a cache in front of a query nobody has read. A missing index or a full scan does not become fast because a second copy exists, and now correctness is a second problem.
- Memoizing everything. Comparison is not free, and a memo that receives a fresh object every render pays the cost and gets none of the benefit.
- Virtualizing without touching render fan-out. Forty rows re-rendering on every keystroke is still forty renders you did not need.
- Optimizing the first load of an app people keep open all day. The bundle matters, and INP on the filter matters more, every hour, to every user.
- Fixing it once with no budget and no test. Six weeks later a new column arrives with a per-cell formatter and the console is slow again, with no CI signal that anything changed.
A first week that produces numbers
Performance Engagement — Week One
A week is enough because every expensive unknown in this domain is measurable inside it. Whether the payload is the problem is measurable. Whether the parse blocks is measurable. Whether the render is dominated by fan-out or by node count is answered by one trace with the React profiler running beside the performance panel. What is not measurable in a week is which of six proposed rewrites would have been fastest, which is why we do not start there.
The last step is the one that keeps the result. A performance budget belongs in CI, checked against a scripted interaction on a fixed dataset with fixed throttling: total payload bytes for the default view, interaction latency for the primary filter, and node count for the table. Lighthouse CI covers the page-level metrics, and a short Playwright script that drives the filter and reads performance entries covers the interaction ones. A budget nobody enforces is a note in a document, and notes in documents lose to shipping deadlines every time.
Before you call it fast
- Interaction latency measured at p75 and p95, bucketed by result-set size
- Payload for the default view checked as bytes and as parse milliseconds, not just as a request duration
- Node count for the largest table verified on the biggest real dataset
- Every long-lived request cancellable, with stale responses discarded rather than rendered
- Charts receiving a series sized to the plot area, reduced by a method that preserves spikes
- Keyboard navigation, screen-reader row indexing, find, and export all working on the virtualized view
- The whole run repeated with CPU throttling at 4x and a constrained network profile
- Budgets enforced in CI, with a named owner for each number
Bottom line
Data-heavy frontends are not slow because of the framework, and they rarely get fast because of a rewrite. They get fast when the server stops sending rows nobody will look at, when the DOM stops holding nodes nobody can see, when a keystroke stops re-rendering half the tree, when charts stop drawing more points than the screen can resolve, and when the parsing and aggregation move off the thread that paints. Measure the interaction rather than the page, write the budget down before optimizing, and put the budget in CI so the next feature has to keep it. That sequence works on almost every console we have opened, and it usually produces the largest win before the end of the first week.
Frequently asked questions
In practice the ceiling is cells rather than rows, and it depends on how much styling each cell carries. Plain rows stay comfortable into the low thousands, and a wide grid with hover states, shadows and per-cell components can stutter well before that. Measure node count and scroll frame time on your real column set rather than picking a number from a blog. If the row count is unbounded because it depends on customer data, virtualize regardless.
Yes when the work is large, repeated, and does not touch the DOM: parsing, filtering, sorting, aggregation, and decoding. Move the whole chain rather than one link, and pay attention to the handoff, because a structured clone of a large object graph can cost as much as the work you moved. Transferable buffers and typed arrays are what make the pattern pay.
Almost always because the chart draws a node or a mark per point and the point count scales with the range while the pixel count does not. Bucket the series server-side to roughly twice the plot width, use a canvas renderer, and keep the minimum and maximum of each bucket so spikes survive the reduction.
It is the most useful one available, because a console is nearly all interaction after load. The 200 millisecond threshold at the 75th percentile is a reasonable bar. Since an authenticated tool never appears in public field datasets, you have to collect it yourself with a PerformanceObserver and report it alongside a metric of your own, such as time from filter change to first painted row.
Below the data path. A console that users keep open all day amortizes the first load across an entire shift, while every filter and sort pays its cost again on every use. Bundle work still matters for the first impression and for cold-start after a deploy, and it is the wrong place to start when the complaint is that the table takes two seconds to respond.