Start with the data that already exists
Ports are unusual among industrial operations in that almost nothing has to be instrumented before analytics can begin. A container terminal is already a dense stream of machine-generated events, because the containers themselves are regulated objects that must be reported to a customs authority, a carrier, a railroad, and a terminal operator at nearly every step. Los Angeles and Long Beach together moved roughly 20 million TEU in 2024. Every one of those boxes generated a gate transaction, a yard position, a crane move, a manifest line, and a customs filing. The raw material is there. What is usually missing is the plumbing that lets those five records agree they are describing the same box.
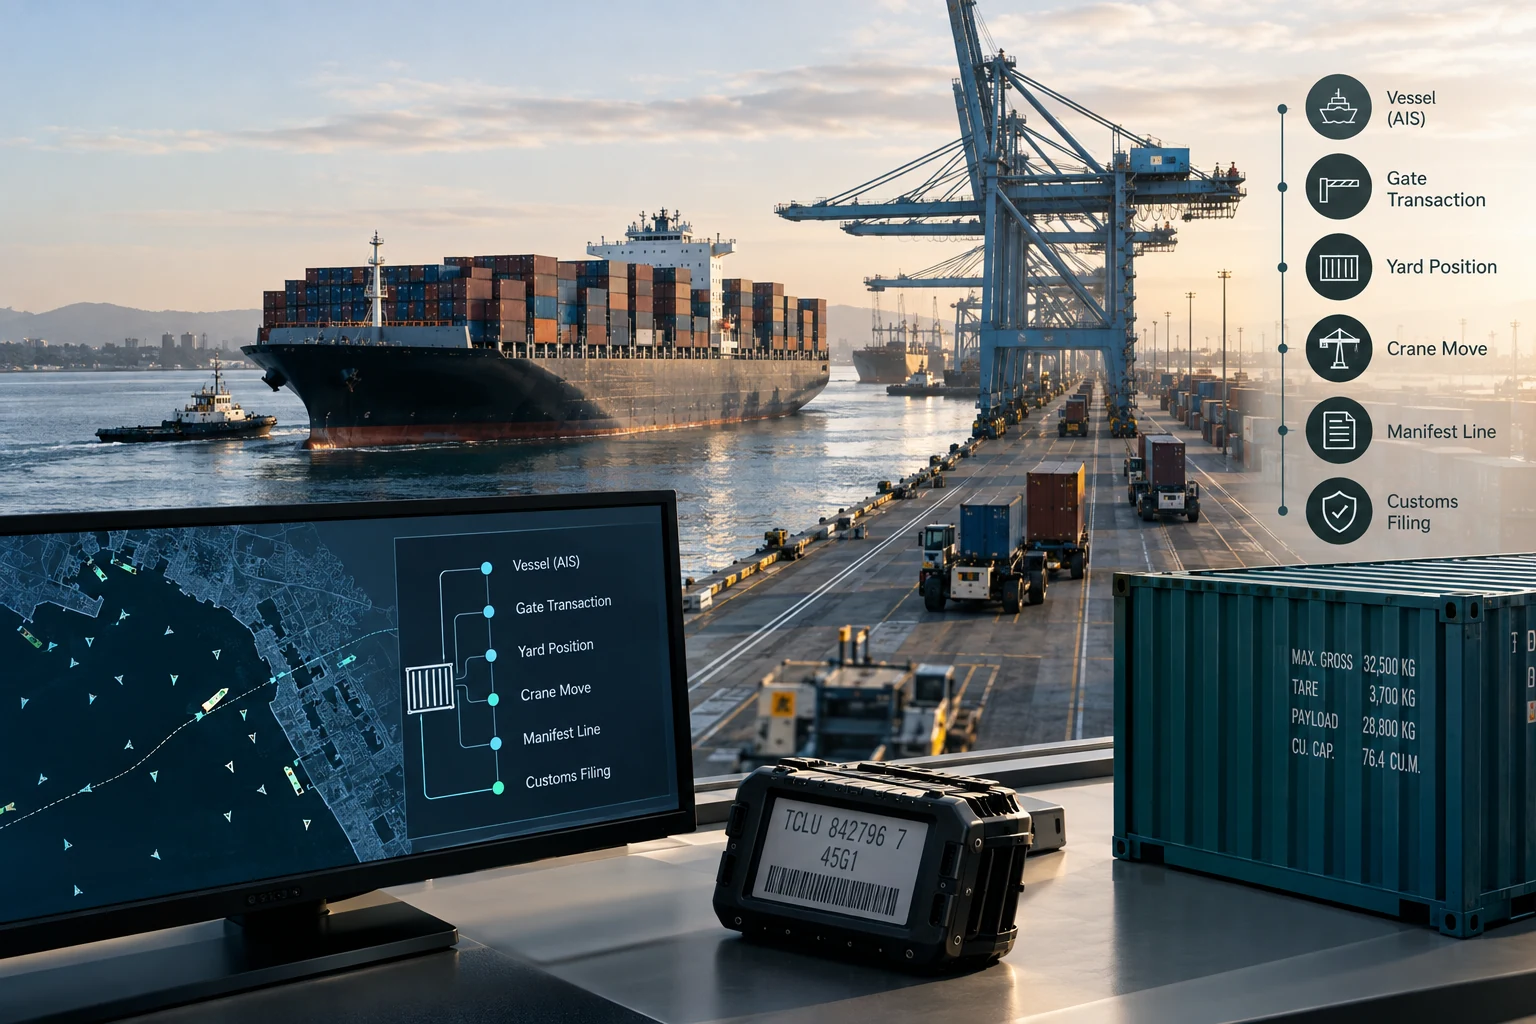
That distinction matters for how a buyer should think about scope. A project that begins "we need better sensors" is a capital project with a two-year horizon. A project that begins "we need the terminal operating system, the gate cameras, and the customs filings to resolve to one container identity with one clock" is a data engineering project with a six-to-ten week horizon. In our experience across federal and commercial data work, the second project produces measurable value first, and it is also the prerequisite for the first one to be worth anything.
Typical readiness by data source at a container terminal
Editorial weighting from public sources and practitioner reading. Illustrative, not a measured statistic.
Vessel movement: AIS and its blind spots
Automatic Identification System broadcasts are the cheapest high-quality feed in the industry. Carriage is mandatory under SOLAS Chapter V Regulation 19 for ships of 300 gross tonnage and above on international voyages, and the Coast Guard extended carriage to a much broader set of commercial vessels in U.S. navigable waters under 33 CFR 164.46. A Class A transponder broadcasts a position report every 2 to 10 seconds while underway and every 3 minutes at anchor, plus a static and voyage message roughly every 6 minutes carrying the IMO number, call sign, draught, destination, and the crew-entered ETA.
A shore receiver delivers those messages in under a second. Commercial aggregated feeds typically land in 5 to 60 seconds. Satellite AIS is a different animal: revisit for a given vessel ranges from about 10 minutes in dense constellations to several hours in the open ocean, so anything built on satellite coverage needs to tolerate gaps of that scale rather than treat them as data loss.
The blind spot is the human-entered fields. Destination is free text, so the same berth appears as a UN/LOCODE, a terminal nickname, and a misspelling in the same week. The ETA field is typed by the crew and is frequently a plan rather than a prediction. Any model that consumes the AIS destination string without normalization is learning the typing habits of watch officers. The fix is not glamorous: a maintained lookup table from raw destination strings to UN/LOCODE values turns a noisy field into a joinable key. UNECE maintains over 100,000 location codes and publishes updates twice a year, which is a real anchor to normalize against instead of an invented internal scheme.
Terminal operating data: the EDI backbone
The terminal operating system is the system of record for every container move. Navis N4, Tideworks Mainsail, and Cyberlogitec OPUS dominate the North American installed base, and all of them emit and consume standardized messages. On the UN/EDIFACT side, CODECO carries gate-in and gate-out events, COARRI reports discharge and load, COPRAR carries the discharge and load order, and BAPLIE carries the bay plan showing occupied and empty slots. On the ANSI X12 side, the 315 carries ocean status details, the 322 carries terminal operations events, and the 214 carries motor carrier shipment status.
These are the highest-value records a port owns, because they are machine-generated, timestamped, and already tied to a container number. A terminal handling 2 million TEU per year processes on the order of 3 to 5 million container moves across gate, yard, rail, and vessel, and each move generates several events. Call it 10 to 20 million rows a year, which is a small dataset by modern standards. Stored as compressed Parquet, a decade of terminal events fits in a few hundred gigabytes, and at Amazon S3 Standard list pricing of $0.023 per GB-month that is a rounding error against a single salary.
The catch is semantics. Two terminals both emit a "gate in" timestamp, and one records the moment the truck crosses the inbound sensor while the other records the moment the clerk closes the transaction. Those differ by eight minutes on a good day. Before any model is trained, every timestamp in the pipeline needs a written definition, a source system, and a timezone, and the clocks need to be checked against each other. We have seen more analytics work die on undocumented timestamp semantics than on model selection.
Customs and trade data
Customs data is the richest description of what is inside the box, and it arrives before the box does. The Importer Security Filing, commonly called 10+2, requires ten data elements from the importer and two from the carrier under 19 CFR part 149, filed no later than 24 hours before cargo is laden aboard a vessel at the foreign port. The separate 24-hour advance manifest rule at 19 CFR 4.7 requires the carrier to transmit the cargo declaration on the same clock. Both flow through CBP's Automated Commercial Environment. Non-compliance is not theoretical: CBP has assessed liquidated damages of $5,000 per ISF violation.
For a buyer, that means commodity-level information, HTS classification, shipper and consignee identity, and container-level detail are available days ahead of arrival. That advance window is what makes forecasting tractable at all. It is also legally constrained. Vessel manifest data is public under 19 U.S.C. 1431(c), which is why bill-of-lading data vendors exist, but importers and consignees may request confidential treatment of their name and address under 19 CFR 103.31(d). A system that re-identifies parties who filed for confidentiality is a legal problem, not a clever feature.
| Data family | Typical volume | Usable latency | Who controls access |
|---|---|---|---|
| AIS position and voyage | Millions of messages daily in a busy approach | Under 1 second shore, 10 min to hours satellite | Open broadcast; aggregators sell cleaned feeds |
| TOS move events | 10–20 million events per year at 2M TEU | Seconds to minutes | Terminal operator, via TOS vendor interfaces |
| Customs filings | One filing set per shipment, days ahead | 24 hours to several days before arrival | CBP through ACE; broker and importer agreements |
| Gate OCR and appointments | Thousands of transactions per gate per day | Sub-second at the lane, minutes to the warehouse | Terminal operator and appointment system vendor |
| Environmental and tide | Six-minute observations per station | Minutes, public API | NOAA CO-OPS and the PORTS network |
| Rail and drayage status | Hundreds to thousands of events per day | Minutes to hours, uneven | Railroads and motor carriers, by agreement |
Dwell time is four different numbers
Dwell is the metric everyone asks for and almost nobody defines the same way. Import container dwell at a marine terminal, rail-bound container dwell in the on-dock yard, chassis dwell, and empty container dwell are four distinct quantities with four distinct drivers. The Pacific Merchant Shipping Association publishes monthly dwell figures for the San Pedro Bay terminals and reports them by category for exactly this reason. The Bureau of Transportation Statistics runs the Port Performance Freight Statistics Program, mandated by Section 6018 of the FAST Act, which publishes annual throughput and performance data for the largest U.S. ports and gives an outside reference point for anyone's internal numbers.
The practical consequence is that a dwell prediction model needs to name which dwell it predicts, in the first sentence of the specification, before anyone writes code. A model that predicts blended dwell across all four categories will look accurate in aggregate and be useless for any actual decision, because the decisions differ. Rail-bound dwell drives on-dock yard planning. Import dwell drives free-time and demurrage exposure. Empty dwell drives repositioning. One number cannot serve three decisions.
The uses that pay for themselves
The applications with defensible economics share a property: they change a decision that someone makes many times a day, where being right a little more often has a direct cost consequence.
- Berth and vessel arrival forecasting. An ETA better than the crew-entered field moves labor ordering and pilot scheduling. Global schedule reliability tracked by Sea-Intelligence has run in the rough range of 50 to 65 percent in recent years, so the headroom is real.
- Gate volume and turn-time prediction. Hourly truck arrival forecasts drive lane staffing and appointment release. Turn times are measured in minutes and the Harbor Trucking Association publishes them, so improvements are externally visible.
- Demurrage and detention exposure. Predicting which containers will breach free time lets a cargo owner act while action is still cheap.
- Yard position and re-handle reduction. Every avoided re-handle is a crane cycle saved. This is where a modest accuracy gain converts to equipment hours directly.
- Exception detection in documents. Mismatches across the manifest, the ISF, and the TOS record surface as structured discrepancies instead of as a clerk's discovery at the gate.
- Empty container repositioning. Forecasting empty returns by equipment type against street-turn opportunities reduces both storage and drayage miles.
Two categories tend to sound better than they perform. Whole-port digital twins built before the identity layer exists produce beautiful visualizations of data nobody trusts. And crane or equipment control optimization is not a first project, for reasons covered in the next section.
Rules that shape the architecture, not just the paperwork
Maritime facilities carry security obligations that determine system design. The Maritime Transportation Security Act regime at 33 CFR parts 105 and 106 governs facility security plans, and unescorted access to secure areas requires a Transportation Worker Identification Credential under 49 CFR part 1572. Any analytics system that ingests gate video, driver identity, or credential scans is holding personal information about a workforce, and that pushes it into a different handling class than container events.
Cybersecurity moved from guidance to regulation. The Coast Guard's final rule on cybersecurity in the Marine Transportation System was published in January 2025 and took effect on July 16, 2025, adding requirements at 33 CFR part 101 for a Cybersecurity Officer, a cybersecurity assessment, incident reporting to the National Response Center, and a Cybersecurity Plan on a phased schedule running into 2027. The Coast Guard also issued Maritime Security Directive 105-4 addressing cyber risk management measures for certain ship-to-shore crane equipment. Anyone proposing to connect a model to terminal operations should expect those obligations to be part of the conversation.
That leads to the single most important architectural rule in this domain: keep the model out of the control loop. Crane control, vessel traffic services under 33 CFR part 161, and equipment interlocks are safety systems. The operational technology network they sit on should be segmented from the analytics environment along IEC 62443 zone and conduit lines, with data flowing one way, out of operations and into the data platform. An advisory system that recommends a yard position to a planner is a software project. A system that commands a crane is a safety-certification project with a completely different cost structure, and it is not where a first engagement belongs.
One more rule with direct data implications: the Federal Maritime Commission's demurrage and detention billing regulation, issued under the Ocean Shipping Reform Act of 2022 and effective May 28, 2024, requires invoices to carry a defined set of elements, requires the billing party to issue an invoice within 30 calendar days after charges stop accruing, and gives the billed party at least 30 days to seek mitigation. That converts a billing dispute into a data completeness problem. A firm that cannot reconstruct the timeline of a container within its own systems cannot defend or contest those charges.
Why data quality decides the outcome, not model choice
Nearly every port analytics project that fails does so on identity resolution and timestamps, not on algorithm selection. The good news is that maritime has unusually strong built-in validation, and most teams do not use it.
Container numbers follow ISO 6346: a four-letter owner prefix, six digits, and a check digit computed by a modulo-11 scheme. That check digit means every container number in a dataset can be validated mechanically, and gate OCR errors, which run at a few percent on worn or dirty boxes, are largely catchable at ingest rather than three joins downstream. IMO vessel numbers carry a check digit as well, and MMSI values encode a country prefix that can be cross-checked against the vessel registry. Carrier identity normalizes to SCAC codes maintained by the NMFTA. Locations normalize to UN/LOCODE. Every one of these is a free integrity constraint.
Timestamps need the same discipline applied by hand. Our practice is to require, for every time field entering a pipeline, four facts written down: the source system, the physical event it marks, the timezone and whether it observes daylight saving, and the expected clock drift against the reference. Terminals commonly run gate systems, TOS servers, and OCR appliances on separately synchronized clocks. A five-minute skew is invisible in a dashboard and fatal in a model trying to learn a thirty-minute effect.
This is why we push buyers to fund a data quality baseline as a named deliverable rather than as invisible preparation. Percentage of container numbers passing the ISO 6346 check. Percentage of records joining across TOS, gate, and manifest. Distribution of clock skew by source. Rate of free-text destination strings resolving to a UN/LOCODE. Those four measurements predict the ceiling on model performance more reliably than any architecture diagram, and they can be produced in the first two weeks.
What it costs to run
Buyers are often surprised how cheap the infrastructure is once the scope is honest. A decade of terminal move events in compressed columnar storage is a few hundred gigabytes. Query engines priced per data scanned, such as Amazon Athena at $5.00 per terabyte scanned in commercial regions, cost a few dollars a day against a partitioned dataset of that size. A streaming ingest of AIS plus gate events at a large terminal is a few hundred messages per second at peak, which is a modest single-node workload before anything is sharded.
Model serving is similarly small. Arrival, dwell, and gate-volume forecasts are tabular problems where gradient-boosted trees and well-specified time-series models remain the accuracy leaders, and they run on CPU in milliseconds. GPU cost enters only if the scope includes vision on camera streams, and even then a single inference node handles several lanes. Federal cloud regions carry higher list prices than commercial ones, so budget accordingly, but the shape of the bill does not change. Any proposal where infrastructure dominates the budget is describing something other than what the data supports.
How to scope a first engagement that can fail cheaply
The structure we recommend is a fixed-scope, fixed-price engagement of eight to ten weeks against exactly one decision, with a written kill criterion agreed before the work starts. One decision, not a platform. A named baseline the model must beat. A holdout period the modeling team does not see. And a defined number that ends the project if it is not reached.
A first engagement structured to fail cheaply
Two details make the difference between a cheap failure and an expensive one. First, the data quality baseline in week two is a real gate. If container numbers fail the ISO 6346 check at 12 percent and only 60 percent of gate records join to a TOS move, the honest recommendation is to fix that and stop, and the buyer has spent two weeks learning something true instead of six months learning it slowly. Second, the shadow run has no operational authority. The model produces a recommendation, the human decides, and both are logged. That gives an unarguable comparison and removes the safety question entirely from the pilot.
Note what survives a failed project under this structure. The identity layer, the timestamp definitions, the quality instrumentation, and the historical event store all remain, and they are the expensive part. A second attempt at a different decision starts at week four rather than week one.
Where federal money touches this work
Port data work sits across several federal channels. The Maritime Administration runs the Port Infrastructure Development Program, funded at $2.25 billion over five years by the Infrastructure Investment and Jobs Act, and digital and operational efficiency scopes are eligible alongside concrete and cranes. The Department of Transportation runs a single SBIR solicitation across its modal administrations including MARAD, and the Department of Homeland Security's SBIR program reaches Coast Guard mission needs. NOAA's Center for Operational Oceanographic Products and Services operates the PORTS network of real-time water level, current, and meteorological sensors, and its public API is the standard environmental input for any arrival model. Internationally, amendments to the IMO Facilitation Convention made a maritime single window for electronic data exchange mandatory for ports from 1 January 2024, which pushes port authorities toward standardized interfaces and makes integration work more durable than it was a decade ago.
Bottom line
Ports do not have a data shortage. They have an identity problem, a clock problem, and a definitions problem, and those three are solvable in weeks by people who have built production data systems before. The model choice, when the time comes, is usually boring and should be. Our team builds the ingest, the identity layer, the quality instrumentation, and the forecast service as one delivered system, on the buyer's cloud account, with the failure conditions written down before the first line of code. If the data will not support the decision, we would rather both parties know that in week two.
Frequently asked questions
AIS broadcasts are open, and cleaned commercial feeds are widely sold. Vessel manifest data is public under 19 U.S.C. 1431(c), subject to confidentiality requests filed under 19 CFR 103.31(d). NOAA environmental data, Army Corps waterborne commerce statistics, and the Bureau of Transportation Statistics port performance series are public. Terminal operating system events, gate records, and appointment data are proprietary to the operator and require an agreement.
It depends entirely on which dwell is being predicted and on how complete the join is between customs, terminal, and drayage records. Ask any vendor for the baseline they beat, the holdout window, and the error distribution by category rather than a single headline accuracy figure. Blended dwell numbers across import, rail, chassis, and empty categories are not decision-grade.
The Coast Guard's cybersecurity rule for the Marine Transportation System, effective July 16, 2025, applies to regulated U.S. vessels and facilities and brings requirements for a Cybersecurity Officer, assessments, incident reporting, and a plan on a phased schedule. An analytics platform connected to a regulated facility's networks falls inside that conversation, which is why the operational technology and analytics environments should be segmented from the start.
A terminal handling 2 million TEU per year produces on the order of 10 to 20 million move and status events annually. Compressed columnar storage keeps a decade of that in a few hundred gigabytes. The engineering effort is in integration and identity resolution, not in volume.
Usually not. Gate OCR is often already present in the terminal's equipment, and its output can be validated against the ISO 6346 check digit at ingest for a fraction of the cost of a new vision pipeline. Vision is worth funding once the identity layer exists and a specific gap has been measured.