The data that actually exists
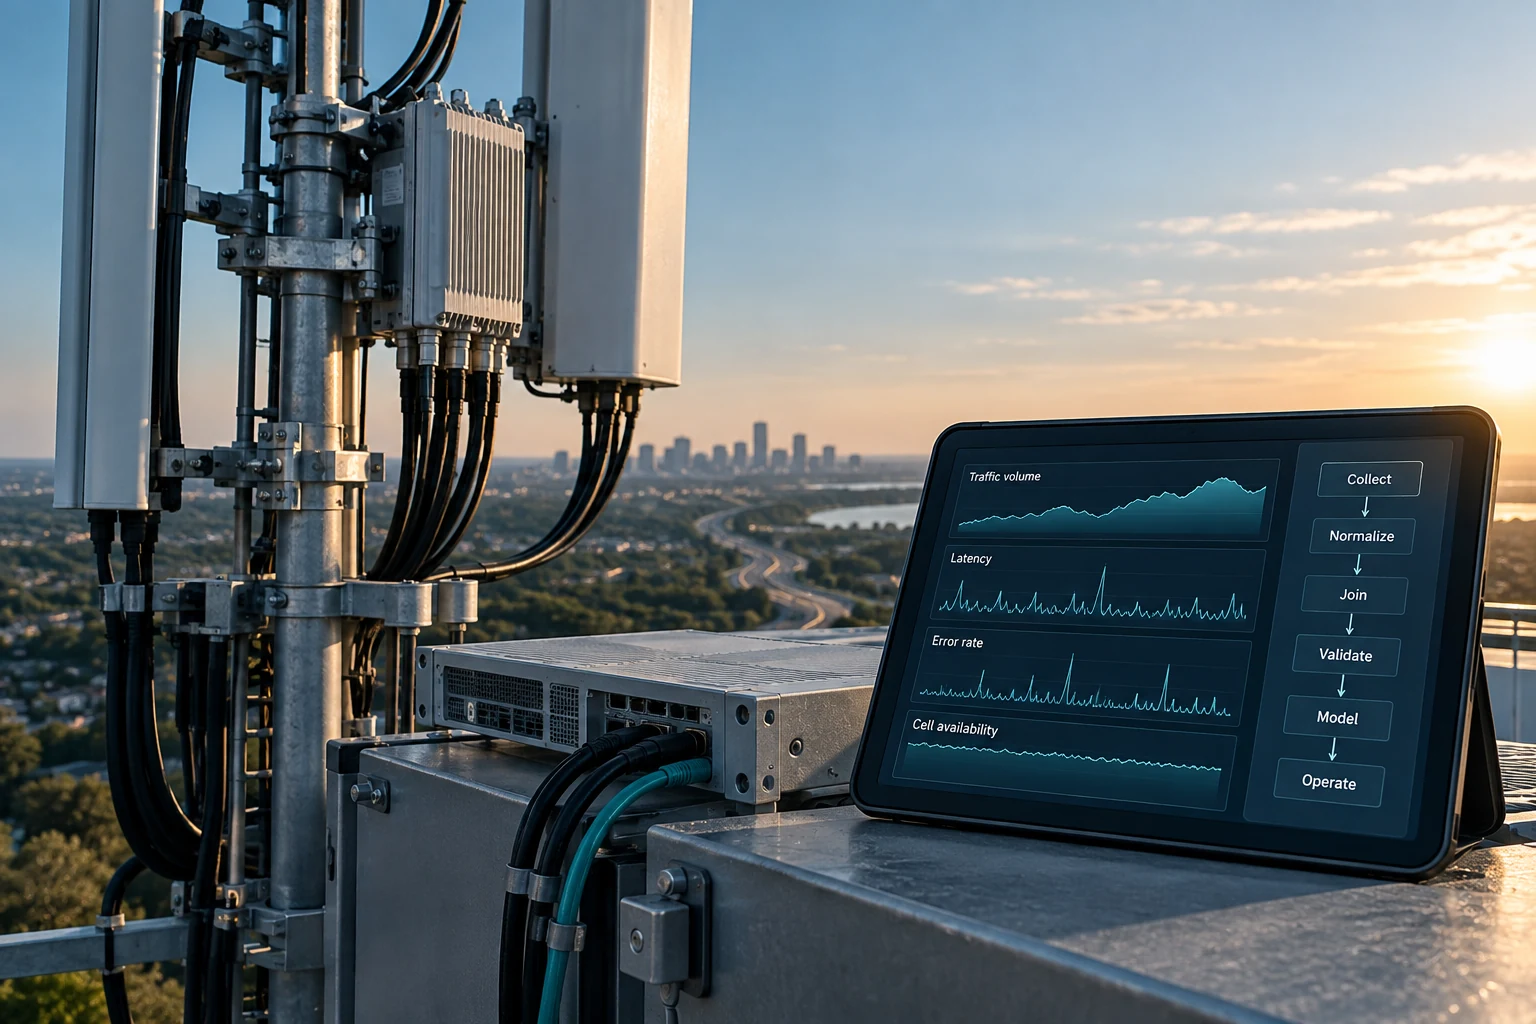
Almost every telecommunications operator we speak with believes it has a modeling problem. In our experience it nearly always has a plumbing problem wearing a modeling costume. The methods that work on network data are not exotic: gradient-boosted trees, seasonal time-series decomposition, a few well-understood anomaly detectors, and increasingly a language model doing narrow text work under supervision. What decides whether a project produces a number the operations floor will act on is whether the records join cleanly, carry consistent timestamps, and were labeled by somebody who saw the failure.
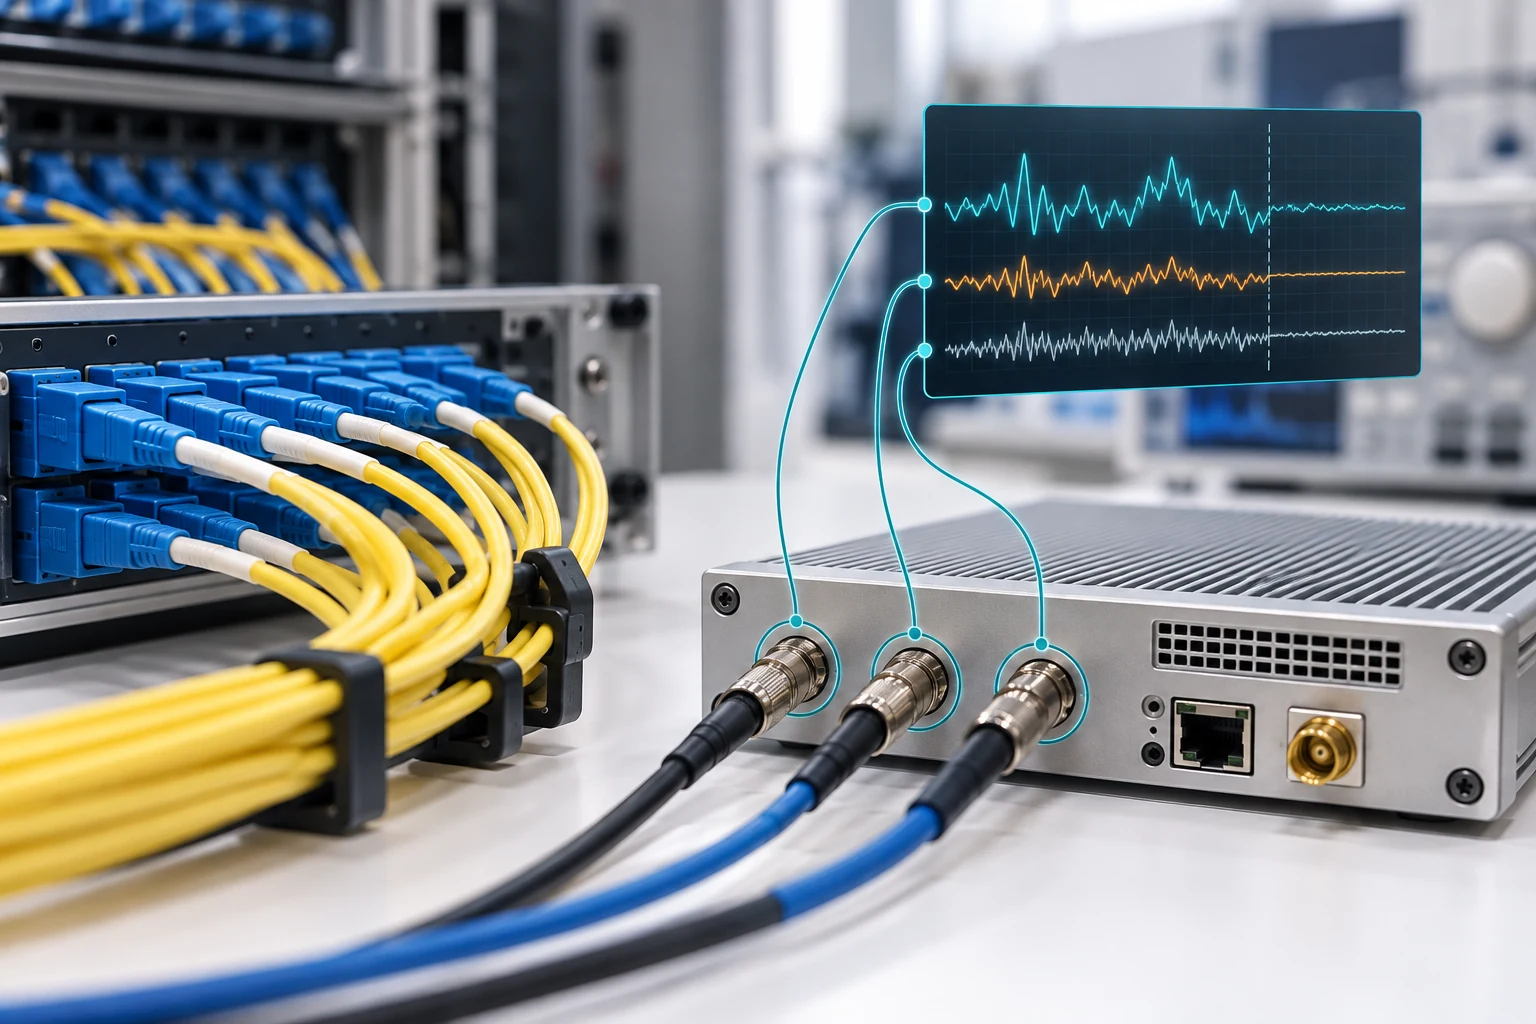

Six families of data sit in essentially every operator, and quality varies far more than availability. Performance management counters come out of the vendor element management systems on a fixed reporting period, almost always 15 minutes. Fault management delivers alarms with severity, probable cause, managed object, and raise and clear timestamps. Configuration and inventory data lives in at least two places that disagree. Transactional records include session detail records from the core plus RADIUS, DHCP, and per-subscriber statistics off a CMTS or OLT on the wireline side. Customer and field data covers trouble tickets, work orders, dispatch outcomes, and care transcripts. Last comes handset-side measurement: minimization-of-drive-test reports defined in the 3GPP specifications, and purchased crowdsourced feeds.
Notice what is missing. There is no clean table of failures, and no field that reliably says what caused an outage. Constructing those is usually two-thirds of the engagement.
Volume, in numbers you can plan against
Vagueness about volume sets budgets wrong in both directions, so work an example. A regional mobile operator with 5,000 sites and three sectors per site has roughly 15,000 cells per carrier layer, or about 45,000 cell-carriers across three band layers. At 3,000 counters per cell-carrier per 15-minute period, that is 135 million values every quarter hour and about 13 billion values a day. Stored naively at 30 bytes per value, a day is near 390 GB. Columnar formats with dictionary and delta encoding routinely reach 10:1 to 20:1 on counter data, because the values are small integers that change slowly. That puts a day between 20 GB and 40 GB and a year of retained history in the 7 TB to 15 TB range.
At the two to three cents per gigabyte-month commercial object storage lists, a year of compressed counters costs a few hundred dollars a month, and government regions run higher. The expensive part is never the bytes. It is the query pattern: a year of history for 45,000 cells at 15-minute granularity is a scan no row-store database will serve, and the fix is a partitioning decision made on day one rather than a bigger instance bought in month four.
Fault data is far smaller and far messier. A network that size produces a few hundred alarms a minute in steady state and tens of thousands in the minutes after a fiber cut. Streaming telemetry is the real volume risk: replacing 5-minute SNMP polling with gNMI or OpenConfig streaming at 10-second intervals raises collection volume by one to two orders of magnitude, and teams routinely turn it on before deciding what they will do with it. Set the retention tier and the aggregation before the collector goes live.
Problem-Class Fit / Telecom Data Work
Editorial weighting from public sources and practitioner reading: illustrative, not a measured statistic.
Latency decides the architecture before the model does
The fastest way to waste a year in telecom is to build something excellent for the wrong control loop. Network decisions live in tiers, each with a hard time budget that determines what can run there. The O-RAN Alliance architecture makes those tiers explicit through the RAN Intelligent Controller split, which is useful vocabulary even for operators with no O-RAN deployment at all.
| Control loop | Time budget | What is realistic there |
|---|---|---|
| User plane | 1 ms target for ultra-reliable low-latency service under the IMT-2020 requirements | Scheduler and PHY logic. Not an integration point for an outside data team. |
| Near-real-time control | 10 ms to 1 second | Small inference-only models as xApps over the E2 interface. Determinism matters more than accuracy. |
| Non-real-time control | 1 second and up, usually minutes | Policy, parameter optimization, and self-organizing-network functions as rApps over A1. |
| Operations analytics | 15 minutes to hourly | Forecasting, anomaly detection, alarm correlation, dispatch triage. The largest and safest surface for new work. |
| Planning | Daily to quarterly | Capacity, capital prioritization, build sequencing, spectrum layer strategy. |
An outside engineering team adds value in the bottom three rows almost immediately, and in the second row only through a vendor integration path that takes quarters. A proposal promising a model inside the radio scheduler either describes a multi-year vendor program or has not read the interface documentation.
The rules that shape the architecture
Telecom is one of the few industries where the privacy constraint sits on exactly the field the model wants most. Customer proprietary network information is defined in 47 U.S.C. § 222 and governed by FCC rules at 47 CFR §§ 64.2001 through 64.2011. It covers who a subscriber called, when, for how long, and what services they bought, and carriers file an annual CPNI compliance certification with the Commission by March 1 under § 64.2009(e). That is also the richest join key inside a carrier. The architectural decision therefore comes first: build the pipeline so the model never touches raw CPNI, or so it sees only a tokenized surrogate produced inside the carrier boundary.
Breach obligations tightened. Under the FCC data breach rules effective March 2024, covered providers notify the Commission, the FBI, and the Secret Service within seven business days of a reasonable determination that a breach occurred, and notify affected customers generally within 30 days. The rules reach beyond CPNI to other personally identifiable information. An analytics environment that copies subscriber data outside the production boundary has extended that reportable perimeter.
Outage reporting is what gives prediction work its dollar value. Under 47 CFR Part 4, providers file into the Network Outage Reporting System when an outage crosses defined thresholds, including the widely used trigger at § 4.9 for an outage of at least 30 minutes that potentially affects at least 900,000 user-minutes. Outages affecting a 911 special facility carry a sharper clock: notification to the Commission within 30 minutes of discovery, an initial report at 72 hours, and a final report at 30 days. The Commission also collects situational data through the Disaster Information Reporting System during activations. When an operator asks what an avoided outage hour is worth, part of the answer is regulatory exposure.
Three more constraints shape build decisions. The Communications Assistance for Law Enforcement Act, 47 U.S.C. §§ 1001 through 1010, keeps lawful intercept on its own audited path, and an analytics platform must never grow into an accidental intercept capability. Section 889 of the FY2019 National Defense Authorization Act, Pub. L. 115-232, implemented at FAR 52.204-25, restricts covered telecommunications equipment for federal and federally funded work, and that reaches the collector hardware as surely as the radio. The Secure and Trusted Communications Networks Act of 2019, Pub. L. 116-124, funds equipment replacement the Commission valued near $4.98 billion against an initial $1.9 billion appropriation, with roughly $3.08 billion added through the FY2025 defense authorization. For operators inside that program, the network of record is changing underneath the training data.
Outage prediction, with the arithmetic in the open
Rare-event prediction is where telecom projects most often produce a beautiful chart and no operational change, because the base rate does the deciding and nobody wrote it down. Take the same 45,000 cell-carriers. Suppose hard faults requiring intervention run at 0.2 percent per cell-carrier per month, which is about 90 events a month. Suppose the model reaches 70 percent recall at 12 percent precision, a respectable result on this class of problem. It catches 63 of those events and issues 525 alerts a month, roughly 18 a day.
Whether that is a win is not a data science question. It is arithmetic the operator answers with three of its own numbers: the loaded cost of investigating one alert, the share of caught events a pre-emptive action would genuinely have prevented rather than merely predicted, and the avoided cost of the outage including the regulatory exposure above. Ask the operator for its own dispatch cost rather than importing an industry average. If the operations center can absorb 20 investigations a day, precision at 20 alerts per day is the governing metric, and area under the curve is a diagnostic for the modeler rather than a result for the customer.
Lead time is the second thing to fix before modeling. A prediction that fires 20 minutes ahead of a failure on a component with a four-hour sourcing and dispatch cycle is a report, not a control. The horizon has to exceed the response time of the action it triggers.
Capacity planning is forecasting with a procurement deadline
Per-cell and per-port traffic forecasting is the most reliably profitable analytics work in a network operator, and the model family matters less than two other choices. The first is horizon: a forecast has to land far enough ahead of the order to change the order. Carrier adds, tower crew scheduling, and backhaul circuit provisioning each carry their own interval, and a six-week-ahead forecast on an item with a twenty-week lead time is decoration. Ask procurement for the real interval by item type.
The second choice is what happens when the physical network changes. When a sector is split, a band is added, or a site is re-homed, the cell's history stops describing the cell, and naive retraining learns the discontinuity as seasonality. The correct handling is a change log joined to the time series, an explicit regime marker, and forecasts reconciled hierarchically so cell-level predictions sum to the market-level number the capital plan uses. Holidays, stadium events, and campus calendars belong in the feature set as known future regressors rather than being absorbed as noise.
Measure against the decision, not the curve. Congestion hours avoided, upgrades deferred without a key performance indicator breach, and capital moved to the sites that needed it are all countable within two quarters. A forecast accuracy gain nobody can trace to a purchase order is not a result.
Why data quality decides the outcome
In network data the model choice is rarely the swing factor. These seven defects are, and they appear in almost every engagement.
- Identity churn. Cell identifiers get reused and renumbered, so a naive join stitches two physical objects into one history.
- Timestamp discipline. Counters arrive in UTC, tickets in local time, field records in whatever the device was set to. Daylight saving leaves duplicate and missing hours.
- Counter redefinition. A vendor release changes what a counter measures without changing its name, silently breaking history at the upgrade boundary.
- Alarm floods. One fault raises thousands of downstream alarms, so raw counts encode topology rather than severity until deduplicated against the network graph.
- Label survivorship. The only labeled failures are the ones somebody ticketed, which biases every model toward failure modes that already had detection.
- Inventory drift. Configuration database, physical inventory, and plant records disagree, and the field is right about whatever a technician visited recently.
- Free-text root cause. Closure codes get chosen under time pressure, so the categorical field is less trustworthy than the narrative beside it.
Every one of these is fixable, and none is fixable by a better model. That is why our first two weeks on a network engagement go into reconciliation and join proofs rather than training runs. The reconciliation artifact tends to outlive the model, because it is what makes the next four projects cheap.
The federal and public-sector side
Telecom data work has a large government surface that operators and integrators both underuse. The Broadband DATA Act, Pub. L. 116-130, requires availability filings into the FCC's Broadband Data Collection twice a year against the Location Fabric, and the challenge process that follows is an entity-resolution and geospatial problem before it is anything else. The Broadband Equity, Access, and Deployment Program created by the Infrastructure Investment and Jobs Act, Pub. L. 117-58, put $42.45 billion through NTIA into state broadband offices, and those offices are buying mapping, validation, and subgrantee reporting systems now.
Public safety carries its own stack. Next Generation 911 moves traffic onto emergency services IP networks built to the NENA i3 standard, which changes both the telemetry that exists and the reporting clock. The First Responder Network Authority, created by the Middle Class Tax Relief and Job Creation Act of 2012, Pub. L. 112-96, runs the nationwide public safety broadband network on Band 14 with its own priority and preemption behavior. Shared spectrum under 47 CFR Part 96 puts commercial, priority-licensed, and incumbent federal operations in the same 3.5 GHz band under Spectrum Access System coordination. Federal buyers reach much of this work through vehicles like GSA Enterprise Infrastructure Solutions, with a ceiling around $50 billion.
For anything touching federal information, the FCC layer stacks on top of the usual federal controls: NIST SP 800-171 for controlled unclassified information on contractor systems, FedRAMP authorization for the hosting boundary, and the supply-chain restrictions above. Our team builds to that overlay routinely, and the sequencing advice never changes: settle the boundary before the pipeline, because moving it after an authorization is written costs more than building it twice.
Scoping a first engagement that can fail cheaply
The best first project in a network operator is one narrow question, on a frozen slice of history, with the failure condition written down in advance. That structure protects the buyer and produces a usable answer either way.
A Seven-Week Proof That Can Fail Honestly
Two details decide it. Hold out by time, never by row: random splits on 15-minute telemetry leak the future into the training set through neighboring intervals, and the accuracy number that results is fiction. And beat the incumbent rule rather than a null model. A model that cannot beat the threshold the operations floor already runs, at the agreed alert budget, has told you something valuable for the price of seven weeks.
Size the engagement so it can end without a governance fight. For federal and state buyers the gates are concrete: the micro-purchase threshold at $10,000 under 41 U.S.C. § 1902, and the simplified acquisition threshold at $250,000 under 41 U.S.C. § 134. A proof that fits under the simplified acquisition threshold can be competed and awarded in weeks rather than quarters, and a negative result at that size is information rather than an embarrassment. We write the kill threshold into the statement of work ourselves, because a proof that cannot fail is not a proof.
Network telemetry sits inside what our engineers do every week: high-volume time series, messy joins across systems of record that disagree, delivery into environments with real compliance boundaries. The practice is led by Bo Peng, Founder and Chief Technology Officer, and staffed from a standing bench of named engineers, licensed professional engineers, and domain specialists, with seven cloud certifications across the group. Our habit on network data is to publish the reconciliation before the result, hand over running code rather than slides, and write the honest number.
Common questions on scope and constraints
Can this run without touching subscriber-identifying data?
For capacity forecasting, alarm correlation, degradation detection, and dispatch triage, yes. Those problems live at the cell, port, node, and work-order level, and none require customer proprietary network information. Subscriber-level data becomes necessary only for churn, experience scoring, and per-customer diagnosis, and those should be scoped separately with the privacy architecture settled first.
Do we need a data lake before we can start?
No. A frozen extract covering six to twelve months of the systems involved is enough to answer whether the signal exists. Building the platform first is the common and expensive mistake, because the platform gets designed around assumptions the first real question would have corrected in three weeks.
What if the inventory records are known to be wrong?
That is normal and workable. The reconciliation step quantifies the disagreement rate between configuration, inventory, and field records, and the model is then built only on the subset where identity is trustworthy. Knowing the disagreement rate is itself a deliverable, and it is often the finding that changes the most downstream spending.
Where does a language model genuinely help here?
In the text layer, under supervision: drafting incident summaries from structured event data, normalizing free-text closure narratives into a controlled vocabulary, and retrieving the relevant method-of-procedure document during a fault. It does not belong in the numeric prediction path, where a boosted tree is cheaper, faster, and auditable.
Frequently asked questions
Performance management counters at 15-minute granularity, joined to fault alarms, configuration change history, and closed work orders. The counters carry the signal, the alarms and work orders carry the labels, and the configuration history keeps the joins honest when the physical network changes.
Tens of thousands of cell-carriers times a few thousand counters every 15 minutes puts raw counter data in the hundreds of gigabytes per day, compressing to roughly 20 to 40 GB a day in columnar storage and 7 to 15 TB for a year of history. Storage cost is minor; the partitioning and query design decides whether the data is usable.
Customer proprietary network information under 47 U.S.C. § 222 and 47 CFR Part 64 Subpart U, the FCC data breach notification rules effective March 2024, outage reporting under 47 CFR Part 4, and lawful intercept separation under CALEA at 47 U.S.C. §§ 1001-1010. Federal and federally funded work adds Section 889 supply-chain restrictions implemented at FAR 52.204-25.
Because the base rate and the alert budget were never written down. At realistic failure rates, a model with strong recall still produces many more alerts than true events, and whether that is worth funding depends on the operator's investigation cost and avoided-outage value. Set precision at the achievable alert budget as the target metric before any modeling starts.
One question, six to twelve months of frozen history, a time-held-out evaluation, the incumbent operations rule as the baseline to beat, and a pre-registered threshold below which the work stops. Roughly seven weeks, priced to sit inside a delegated procurement authority so a negative result costs little and still teaches something.