The data that actually exists
Rail and transit are older than almost every data system built around them, and that history is visible in the files. When a railroad, a transit authority, or a state rail office asks us what AI can do for them, the useful first move is not a model discussion. It is an inventory: which of six or seven real data families are present, how many years deep they run, and whether the identifiers inside them line up well enough to join. The answer to that question predicts the outcome of the work more reliably than any architectural choice made afterward.
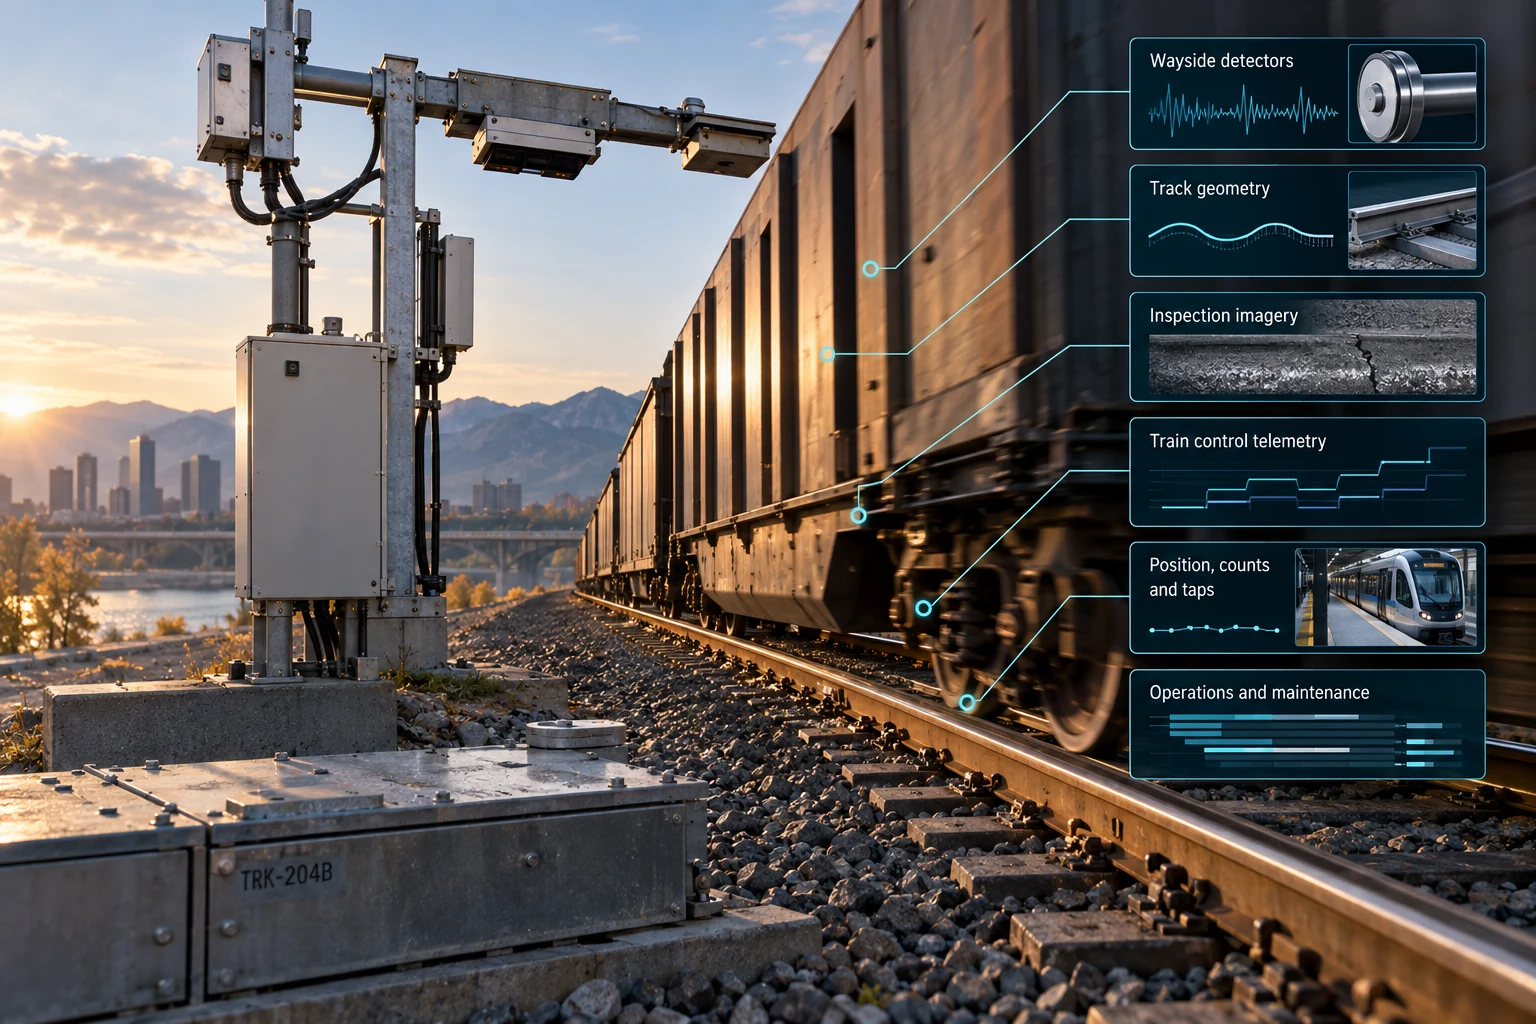
The families are consistent across operators. On the freight side: wayside detector histories, track geometry and rail flaw inspection runs, inspection imagery, locomotive and Positive Train Control telemetry, enterprise asset management work orders, and safety reporting filed with the Federal Railroad Administration under 49 CFR Part 225. On the transit side: computer-aided dispatch and automatic vehicle location feeds, automatic passenger counters, fare collection taps, signal and train control logs, elevator and escalator monitoring, plus the asset inventory an agency already maintains for the Transit Asset Management rule at 49 CFR Part 625 and the National Transit Database under 49 U.S.C. 5335.
That last item is worth pausing on. Because Federal Transit Administration recipients must report an asset inventory with condition ratings, most agencies already hold the most complete asset list in the building: rolling stock measured against useful life benchmarks, facilities scored on the one-to-five TERM scale, and track segments flagged for performance restrictions. It was built for compliance, so it is often stale in places, but it is a real schema with real coverage, and starting from it beats inventing one.
Typical readiness by data family, at first look
Editorial weighting from public sources and practitioner reading — illustrative, not a measured statistic.
Wayside detectors are the richest signal on the freight side
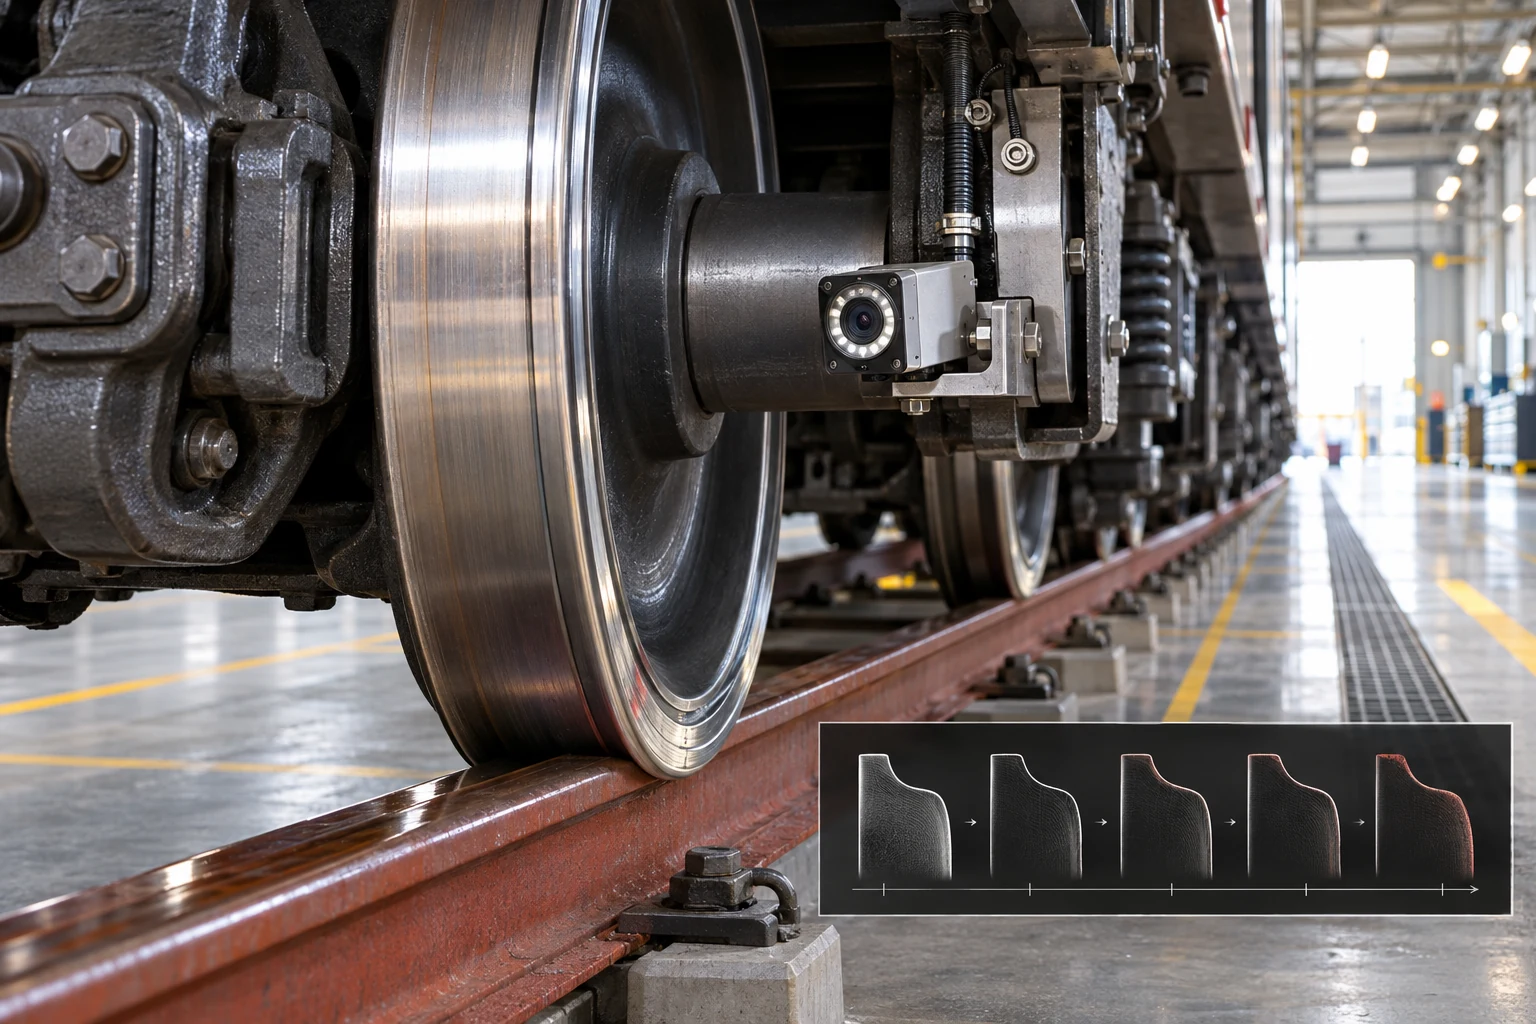
A modern railroad instruments its track, not just its trains. Hot bearing detectors, hot wheel detectors, wheel impact load detectors, trackside acoustic bearing arrays, dragging equipment detectors, and truck performance detectors sit at intervals along the route. Every train that passes generates a per-axle record. An Automatic Equipment Identification reader, using the AAR S-918 RFID standard, ties those readings to a specific car, and the car identifier joins outward to the Umler equipment registry that Railinc maintains for the industry.
The public record on why this matters is unusually clear. In its preliminary report on the February 2023 Norfolk Southern derailment at East Palestine, Ohio, the National Transportation Safety Board described the failing wheel bearing passing three successive hot bearing detectors at roughly 38°F, then 103°F, then 253°F above ambient. The railroad's critical alarm threshold was 200°F above ambient, so the first two readings passed without action. FRA issued a safety advisory on wayside detector systems that year and the industry tightened its standards. The engineering lesson is narrower than the policy one: threshold logic evaluates a single reading in isolation, while the information was in the trajectory across detectors for one bearing.
Volumes here are modest. A 100-car train carries roughly 400 axles, doubled for both sides of the truck. A large operator with several thousand detector sites produces tens of millions of readings a day at a few hundred bytes each, which is single-digit terabytes a year. Ten years of detector history fits in a warehouse costing a few thousand dollars a month to run. Nothing about this is a big-data problem, and treating it as one is a way to spend money without moving a metric.
Track geometry, rail flaw testing, and inspection imagery
Track Safety Standards live in 49 CFR Part 213. Section 213.9 sets the class-by-class speed limits, Section 213.233 sets visual inspection frequency, Section 213.237 governs internal rail flaw inspection, and Section 213.241 covers inspection records. For high-speed track, Subpart G at Section 213.333 requires automated geometry measurement rather than leaving it optional. Those sections are the reason the data exists at all, and they define what an exception means, which is what a model has to predict.
Geometry vehicles sample gauge, cross-level, alignment, profile, warp and related channels at roughly one-foot intervals. A 1,000-mile subdivision run yields about five million samples per channel, which across thirty or forty channels is a few gigabytes. Small. The imagery attached to the same run is where cost appears. Track-facing 4K video at 25 Mbps works out to roughly 280 MB per mile at 40 mph, so a multi-camera inspection vehicle covering 1,000 miles produces several terabytes per pass. Corridor LiDAR at moderate density adds a few hundred megabytes per mile.
Put concrete numbers on that before collection, not after. Fifty terabytes of inspection imagery on Amazon S3 Standard runs on the order of $1,150 a month at published list pricing; the same data in Glacier Instant Retrieval sits nearer $200. The decision to keep every frame forever, or to keep frames only where a geometry channel flagged something, is a five-figure annual decision that gets made by default if nobody makes it deliberately.
Transit runs on position, counts, and taps
A bus or rail transit agency generates three high-value streams. Vehicle positions from the CAD/AVL system, typically refreshed every 15 to 30 seconds and published outward as GTFS-Realtime. Boarding and alighting counts from automatic passenger counters, which FTA permits as a basis for National Transit Database ridership once the units are certified and benchmarked. And fare validations from smartcard or contactless taps, which for a large agency run into the millions on a weekday.
None of these are large. A thousand-vehicle fleet reporting position every 20 seconds produces about 4.3 million records a day, which is a few hundred gigabytes a year raw and far less after compaction into columnar storage. Tap records are smaller still. The sensitivity, however, runs the other direction: a sequence of taps is an origin-destination trace attached to a card, and card traces are re-identifiable. Aggregate to stop-pair and time-bin counts with a minimum-cell threshold before that data crosses out of the agency's controlled environment, and write that threshold into the statement of work rather than deciding it later under pressure.
Train control telemetry is real, useful, and fenced
Positive Train Control was mandated by the Rail Safety Improvement Act of 2008 and is regulated under Subpart I of 49 CFR Part 236. FRA reported the system in operation across all required route miles at the end of December 2020, covering roughly 57,500 route miles. Interoperable Electronic Train Management System equipment carries the freight network, ACSES covers the Northeast Corridor, and Communications-Based Train Control to IEEE 1474 covers urban rail lines that have been converted.
The telemetry is genuinely rich. Locomotive status at one-second cadence across a fleet of five thousand units is roughly 430 million records a day, on the order of 30 TB a year raw and a small fraction of that once column-compressed. The constraint is not volume. It is that the system is certified under an FRA-approved PTC Safety Plan per Section 236.1015, with error and malfunction handling per Section 236.1023 and records retention per Section 236.1037. No competent railroad is going to let an analytics workload live inside that boundary, and no competent vendor should ask.
The architecture that follows is simple and non-negotiable. Analytics reads a one-way copy: a message-bus subscription, a read replica, or a nightly export into a separate plane. Models produce advisories for humans. Nothing written by a model returns to the vital system.
Volumes, latency, and cost in one table
| Data family | Scale at a mid-size operator | Useful latency | What it can answer |
|---|---|---|---|
| Wayside detectors | Tens of millions of readings/day; ~1–3 TB/year | Minutes to hours | Which bearings and wheels are trending toward a set-out |
| Geometry runs | Gigabytes per run; terabytes with imagery | Days between passes | Which segments cross a Part 213 remedial threshold next |
| Train control telemetry | ~430M records/day at 1 Hz fleet-wide | Seconds, read-only | Braking, handling, and route-level running behavior |
| AVL and GTFS-Realtime | ~4.3M positions/day per 1,000 vehicles | 15–30 seconds | Headway regularity, bunching, arrival prediction |
| APC and fare taps | 1–2M records/weekday at a large agency | Daily batch | Loading by segment, service planning, NTD quality |
| Work orders and asset records | Hundreds of thousands of rows, decades deep | Nightly | Failure history, cost per asset, remaining life |
Uses that pay for themselves, with the number they move
The discipline that keeps a rail or transit engagement honest is choosing a metric the operator already reports, then moving it. An improvement in a number that appears in an NTD filing, a Transit Asset Management performance target, or an FRA Form 6180.54 record is defensible in a way that a private benchmark never is.
- Bearing and wheel trending. Precision at a fixed weekly alert budget, measured against the existing threshold rule and scored in avoided set-outs.
- Geometry exception forecasting. Which segments will cross a Part 213 remedial threshold before the next scheduled run, scored in emergency slow orders avoided.
- Speed restriction analytics. Restricted track-miles and end-to-end run time, the same measures agencies published while working restrictions back off.
- Grade crossing risk ranking. FRA's inventory carries roughly 210,000 public and private crossings, and its published prediction formula gives a ranking a model must beat.
- Headway regularity. Excess wait time per rider, computed from AVL rather than from scheduled headway.
- Vertical transportation availability. Elevator and escalator uptime in percentage points, a figure large agencies already post publicly.
- Work order text structuring. Share of records with a real failure code instead of a default one, which is the input every downstream reliability model needs.
Each of those is a supervised problem with a rate metric and a cost attached to being wrong in each direction. That framing matters more than it sounds. A false alarm on a bearing costs a set-out and a delay; a missed one can cost a derailment. FRA's accident reporting threshold is adjusted periodically and sits in the low five figures, so the reportable events are common enough to model and the severe ones are rare enough that raw accuracy is a meaningless score.
Data quality decides this, not model choice
On this class of problem, the gap between a mediocre result and a good one almost never comes from the model family. It comes from four or five specific defects that are boring to fix and fatal to ignore.
Site bias in detector readings. Hot bearing detectors report differential temperature above ambient, and ambient sensing drifts by site, by season, and by sensor age. A model trained on raw differentials learns which detector site it is looking at. Normalizing each reading against that site's own recent distribution, then modeling the residual, is usually worth more than every hyperparameter search combined.
Linear referencing that does not line up. Rail lines carry milepost equations, points where the chainage jumps because of a historical re-survey or a line change. The geometry car, the maintenance system, the signal system, and the GIS layer often resolve those equations differently. A tie renewal recorded at MP 143.2 in the asset system can be the same physical work as a geometry exception at MP 143.4. Joins that look clean produce features that are silently misaligned by a few hundred feet, and the model learns noise.
Time bases. Signal and train control systems log in UTC. Maintenance systems log local time with daylight saving. Geometry vehicles log GPS time. An off-by-one-hour join across a March or November boundary corrupts exactly the seasonal window a reliability model cares about.
Label leakage. The most common way a bearing-failure model reports an implausible score is that its training features include the alarm that caused the car to be set out. The label and the feature are the same event. Every feature has to be constructed from what was knowable at prediction time, which for asset data means a strict temporal split rather than a random one.
Free text and default codes. Maintenance notes describe the same failure a dozen ways, and failure code fields collapse to a catch-all category whenever the technician is in a hurry. Structuring that text is often the highest-value single task in the engagement, and it is ordinary language work rather than anything exotic.
Our experience is consistent on this point: gradient-boosted trees on clean, site-normalized, temporally honest features beat a deep architecture on dirty features nearly every time, and the clean-feature version is the one an operator can actually maintain after handoff.
The rules that shape the architecture
Three constraints do most of the architectural work in this domain, and a buyer should hear them named before signing anything.
Vital and non-vital stay separated. Processor-based signal and train control systems fall under Subpart H of 49 CFR Part 236, with a Railroad Safety Program Plan at Section 236.905, a Product Safety Plan at Section 236.907, and FRA review at Section 236.913. Anything that can command a brake application or change a signal indication carries that full burden of safety analysis. Machine learning does not belong there, and a design that puts it there will not be approved. Advisory outputs to a dispatcher, a roadmaster, or a maintenance planner are a different matter entirely.
Source data is often the compliance record. Inspection records under Section 213.241, accident and incident records under 49 CFR Part 225, and train control records under Section 236.1037 all have retention obligations. A pipeline that transforms those records in place destroys evidence. Originals stay immutable; everything derived lives in a separate layer with lineage back to the source row.
Model outputs that change inspection decisions must be reproducible. If an advisory caused a segment to be inspected or skipped, the operator needs to reconstruct, months later, which model version ran, which input snapshot it saw, and which threshold was in force. That is a versioning and lineage requirement written into the build, not documentation added at the end.
Around those three sit the obligations a buyer will raise in the first meeting. Transit agencies operate under a Public Transportation Agency Safety Plan per 49 CFR Part 673, with rail fixed guideway systems also subject to State Safety Oversight under 49 CFR Part 674, so any tool feeding hazard identification becomes part of the safety plan record. Interfaces used by agency staff or the public fall under Section 508 of the Rehabilitation Act at 29 U.S.C. 794d. Higher-risk freight and passenger railroads carry TSA security directives requiring a cybersecurity coordinator, a 24-hour reporting path to CISA, an incident response plan, and periodic vulnerability assessment, with a broader cyber risk management rule proposed in November 2024. FTA-funded procurements bring Buy America under 49 U.S.C. 5323(j) plus the Build America, Buy America provisions of the 2021 infrastructure law, which reach specified hardware even when the software itself is out of scope. And on federally funded development, data rights run through FAR 52.227-14 or the DFARS clauses at 252.227-7013 and 252.227-7014, with SBIR-developed work carrying a 20-year protection period from award under the SBIR Policy Directive.
Scoping a first engagement that can fail cheaply
The failure mode we see most often is a twelve-month program that stalls in month two at data access and never produces anything a sponsor can point at. The fix is structural. Make the first deliverable something that has standalone value even if the model is never built, and write the kill criteria into the statement of work before anyone starts.
A ten-week first engagement, fixed price
Cost should be equally plain. Engagements of this shape typically price in the tens of thousands to low six figures depending on how many data sources have to be untangled, and a production rollout after a successful pilot is a larger number again. The compute inside it is trivial by comparison: training an image or tabular model on a single mid-range cloud GPU for a week runs on the order of $200 at list pricing, and a few terabytes of working storage is a few hundred dollars a month. The cost of this work is engineering time spent on access, joins, referencing, and evaluation. Any vendor whose quote is dominated by infrastructure on a dataset this size is quoting the wrong thing.
Common questions on scoping
What if the data turns out to be unusable?
Then the profiling report is the deliverable, and it names exactly which fields, which joins, and which retention gaps blocked the work. That document has independent value: it tells an operator what to fix before anyone spends real money, and it is frequently reused as the requirements basis for a data engineering project instead of a modeling one.
Can a model touch the signal or train control system?
No. Anything affecting a signal indication or a brake application falls under the Subpart H safety plan process at 49 CFR 236.905 through 236.913. Our designs read a one-way copy of that data and produce advisories for people. The vital system is untouched, and we say so in writing at the start so nobody discovers the boundary late.
Do we need to move data to the cloud?
Usually not for a first engagement. At these volumes a single well-configured database inside the operator's own environment is enough, and keeping the data where it already sits removes the security review that otherwise consumes the first six weeks. Our engineers work in the customer's environment when that is the faster path.
Who owns what we build?
Set it in the contract before kickoff. On commercial and state work we routinely deliver full rights to the customer-specific model, features, and pipeline. On federally funded development the applicable FAR or DFARS data rights clause governs, and SBIR-developed technology carries its own protection period. Whichever applies, it belongs in the statement of work rather than in a later argument.
Bottom line
Rail and transit data is smaller, older, and more regulated than the pitch decks suggest, and all three of those facts are advantages for a buyer who scopes carefully. The volumes fit on modest infrastructure. The regulations define the labels, so the prediction targets are already specified by 49 CFR rather than invented. And the metrics that matter are ones the operator publishes anyway, which makes a claim of improvement checkable by someone outside the project. Our team builds these systems the way the safety case requires: advisory, reproducible, outside the vital boundary, and evaluated against the rule it is meant to replace.
Frequently asked questions
Wayside detector reading histories, track geometry and rail flaw inspection runs, inspection imagery, train control telemetry, enterprise asset management work orders, and FRA safety reporting under 49 CFR Part 225. Detector histories and geometry runs are usually the deepest and cleanest starting points.
Less than most people assume. A thousand-vehicle fleet reporting position every 20 seconds produces roughly 4.3 million records a day, a few hundred gigabytes a year before compaction. Fare taps and passenger counts are smaller still. Inspection video and LiDAR are the only streams that reach real scale.
Not in the vital path. Processor-based signal and train control systems are governed by Subpart H of 49 CFR Part 236, which requires a Railroad Safety Program Plan, a Product Safety Plan, and FRA review. Analytics belongs in an advisory plane fed by a one-way copy of the data.
Most often at data access and data quality rather than modeling. Detector site bias, mismatched milepost referencing, inconsistent time bases, and label leakage from the alarm that triggered the repair each break a project quietly. Fixing those is the work; the model is the easy part.
Ten weeks, fixed price, one asset class and one question, with a data quality report delivered by week two so the engagement has value even if the model never ships. Write the kill criteria and the alert budget into the statement of work before the first extract runs.