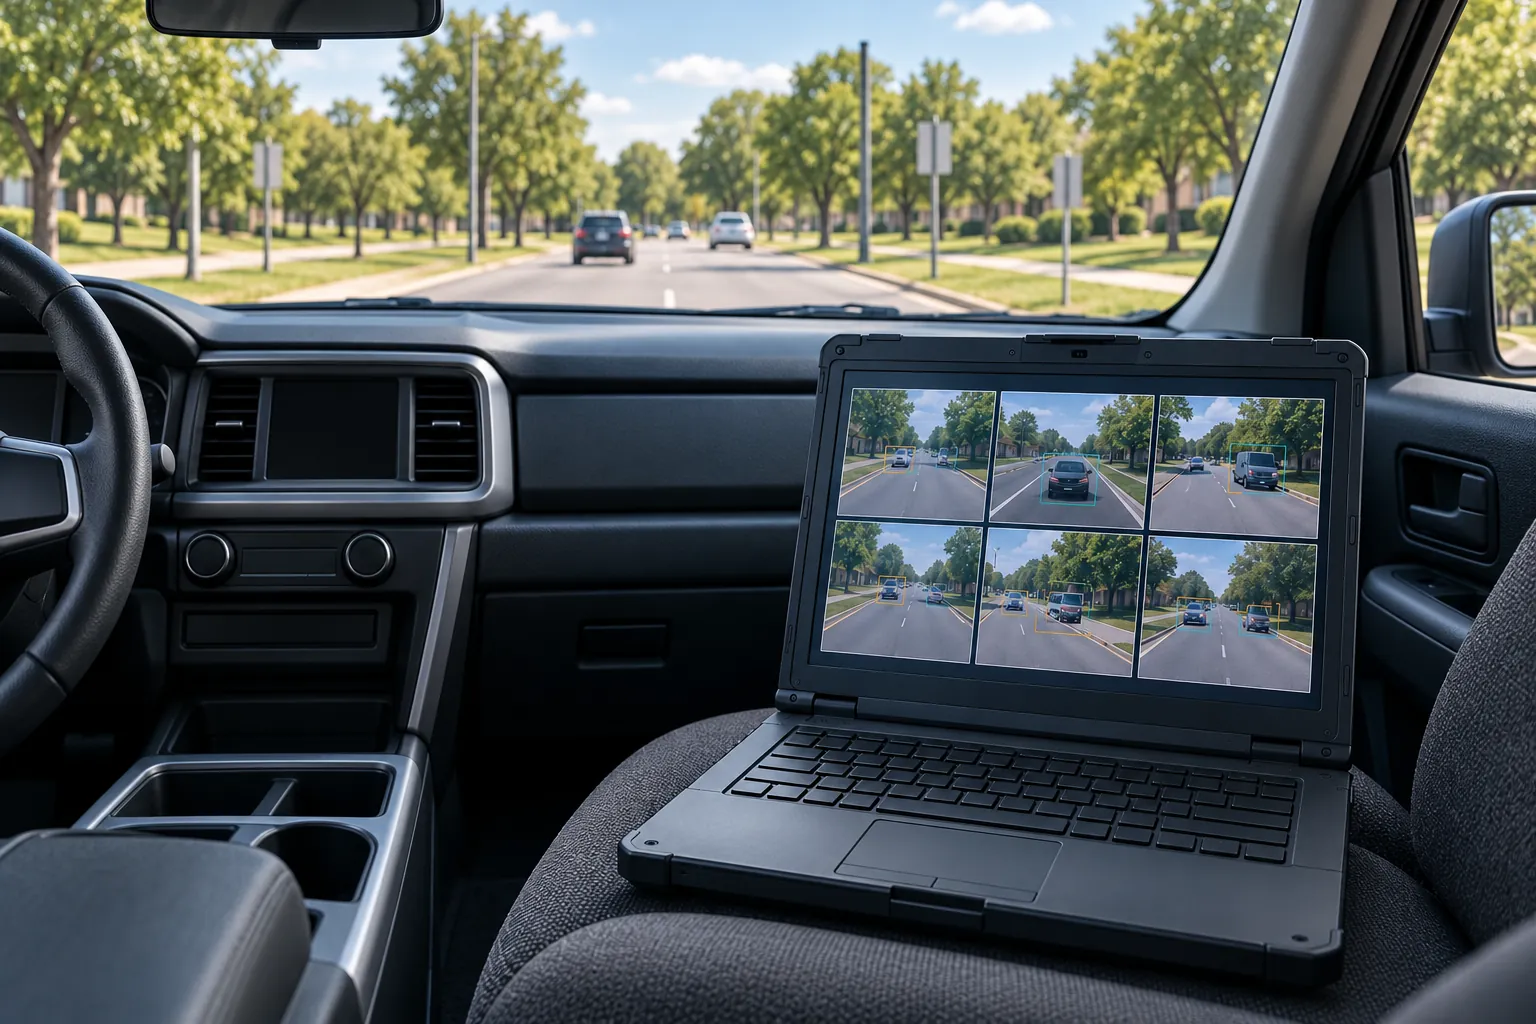
An inventory is a promise about completeness
A sign inventory exists so an agency can answer simple questions with confidence: how many signs it owns, where each one is, what each one says, and which ones are due for replacement. Computer vision can build that inventory from video and imagery far faster than crews with clipboards. Detection models are now good enough that the hard part is no longer finding signs in pictures. The hard part is knowing how many the system missed, placing the rest on the map correctly, and being honest about what imagery cannot tell you. An inventory that looks complete but quietly misses one sign in eight is worse than no inventory, because people will trust it.
This guide covers the pipeline from imagery to inventory, the metrics that make the result trustworthy, how to collect ground truth, the limits of imagery for condition and retroreflectivity, and the review loop that closes the gap. It is written for the program manager or asset engineer who has to accept the inventory and stand behind it.
The pipeline, in five steps
Every sign inventory system does the same five things, whatever it is called.
Detect. Find sign panels in each frame of video or each image, drawing a box around each one. Modern object detectors do this well on clear, frontal views and less well on small, distant, occluded or steeply angled signs.
Classify. Assign each detection a sign type: stop, yield, a speed limit, a curve warning, a street name, and so on. The number of classes matters. A model that recognizes a few dozen common types will lump the rest into "other", and those are often the signs an agency most wants to find.
Read. Extract the legend where it varies: the number on a speed limit sign, the name on a street sign, the distance on a guide sign. This is a separate task with its own error rate.
Locate. Turn detections in images into a position on the ground, using the camera's position and orientation, and estimate which direction the sign faces.
Deduplicate. Merge the many detections of the same sign across frames and passes into one inventory record. Get this wrong and you count one sign five times or merge two signs on the same post into one.
Each step can fail independently, and failures compound. That is why a single accuracy number for the whole system tells you very little.
Why recall comes first
Recall is the share of real signs in the field that end up in the inventory. Precision is the share of inventory records that correspond to real signs. Both matter, but they do not cost the same when they are wrong.
A false positive, a record for a sign that does not exist, is found and removed the first time anyone looks at it. A false negative, a real sign missing from the inventory, is invisible. Nobody reviews a record that does not exist. The missing sign stays missing until it is knocked down, faded or needed for a claim, and then the inventory is shown to be incomplete at exactly the moment it was supposed to help.
Recall is the number to measure first, because nobody reviews a record that does not exist. Measure it against ground truth collected independently of the system. A vendor or model team reporting precision alone, or reporting accuracy on a test set of images that already contain signs, has not told you how many signs are missing.
The metrics and what each one tells the owner
A trustworthy sign inventory reports a small set of metrics, each answering a question the asset owner actually has.
| Metric | How it is computed | What it tells the owner agency |
|---|---|---|
| Recall | Ground truth signs matched to an inventory record, divided by all ground truth signs | How many signs the inventory is missing |
| Precision | Inventory records matched to a ground truth sign, divided by all records | How much review time false records will cost |
| Classification accuracy | Matched signs with the correct type, divided by matched signs | Whether the counts by sign type can be trusted for budgeting and replacement |
| Legend read rate | Matched signs with variable legends read correctly, divided by those signs | Whether speed limits, street names and distances can be used without checking |
| Location error | Distance between matched records and ground truth, reported as median and a high percentile | Whether a crew can find the sign from the record |
| Facing accuracy | Matched signs with facing direction within tolerance | Whether the sign is assigned to the right approach or direction of travel |
| Duplicate rate | Records that duplicate another record of the same sign | Whether counts are inflated |
Report location error as a distribution, not just an average. A median of a meter with a long tail of records twenty meters off means some signs will be placed on the wrong side of an intersection, and the average hides that.
Matching: state the radius and the facing tolerance
Every metric above depends on matching inventory records to ground truth signs, and matching depends on two rules that must be written down before evaluation.
The matching radius is the maximum distance at which a record and a ground truth sign can be considered the same sign. The facing tolerance is the maximum difference in facing direction. A radius of 5 meters and a facing tolerance of 45 degrees, as illustrative values, might suit a rural corridor. Dense urban corners with several signs on nearby posts need a tighter radius, or every sign will match something.
The facing rule matters at intersections, where signs for different approaches stand on the same corner. Without a facing tolerance, a stop sign for one approach can match a stop sign for another, inflating recall and hiding a missed sign.
Publish both values with the results. A recall figure without its matching rules cannot be compared with anything, including the same system evaluated next year.
Measure by sign family
Overall metrics are dominated by the most common signs, and common signs are usually the easiest to detect. A system can report high overall recall while missing many of the less common signs that matter for safety and liability, such as specific warning signs or object markers.
Break every metric down by sign family, at a minimum regulatory, warning and guide signs, and by the specific types the agency cares about most. Also break them down by conditions: urban and rural, near and far from the travel lane, partly obscured and clear, day and dusk. The breakdown tells you where to send the human reviewers and where the model needs more training data.
A ground truth plan
Ground truth is the independent record of what is actually out there, and its quality limits the quality of every metric. It has to be planned as carefully as the collection.
- Sample segments chosen in advance, covering the road types, regions and conditions in the full inventory
- Every sign in the sample segments recorded, not just the ones easy to see from the vehicle
- Collected independently of the system, by a field crew or from separate imagery reviewed by people who have not seen the model's output
- Position measured with known accuracy, with the method recorded
- Type, legend, facing and mount recorded for every sign in the sample
- A second reviewer on a portion of the sample to measure how often people disagree
- Collected close in time to the imagery, so signs installed or removed in between do not count as errors
- Held back from training, so the model is never tuned on the segments used to test it
The agreement check between reviewers is often skipped and should not be. If two careful people disagree on the type of a sign one time in twenty, the system cannot be held to a higher classification accuracy than the ground truth supports.
Placing signs on the map
Location comes from geometry. With a camera of known position and orientation, a sign seen in several frames can be triangulated: each frame gives a ray from the camera through the sign, and the rays intersect near the sign's position. More frames from more angles give a better fix. Signs seen in only one or two frames, or only from far away, get poor fixes.
When LiDAR is collected alongside imagery, the location problem gets much easier, since the sign panel and post appear directly in the point cloud. Projecting image detections onto the cloud gives positions limited mainly by the accuracy of the cloud itself.
Facing is estimated from the panel's orientation in the images or the cloud, or from which direction of travel it was visible from. Record the method, because a facing derived from travel direction alone will be wrong for signs angled toward a side road.
What imagery cannot tell you about condition
Agencies often hope the inventory will also tell them which signs need replacing. Imagery helps, but it has firm limits.
Daytime imagery can show obvious physical damage: a bent post, a knocked-down sign, heavy fading, graffiti, a panel twisted away from traffic. It cannot measure retroreflectivity, the property that makes a sign visible at night under headlights. Retroreflectivity depends on the angle between the light source, the sign and the observer, and a daytime photo does not capture it.
The MUTCD requires agencies to maintain sign retroreflectivity at or above minimum levels using an assessment or management method, such as visual nighttime inspection, measured retroreflectivity, expected sign life, blanket replacement or control signs. Nighttime imagery captured with controlled lighting can support a screening approach, flagging signs that look dim for follow-up. It is not a calibrated measurement. Signs flagged by imagery still need checking with a retroreflectometer or by a trained nighttime inspector if the result will drive a replacement decision. Label imagery-based condition scores as screening scores in the inventory, so nobody mistakes them for measurements.
A human review loop that targets the gaps
No system reaches full recall and precision on its own. A review loop puts people where the model is weakest, rather than spreading review evenly.
Route low-confidence detections, uncommon sign types and unread legends to reviewers first. Have reviewers also check a random sample of high-confidence records, so you keep measuring precision where the model is confident. Send reviewers to segments where recall measured lower, and have them look for signs the system missed. Every correction becomes training data and an update to the metrics.
Keep the review tool simple: the record, the best images of it, a map, and buttons for confirm, correct and reject. Log every decision with who made it, so reviewer quality can be measured too.
Report unlocated detections; do not hide them
Some detections cannot be placed with confidence: a sign seen once, far away, or only partly visible. The tempting choice is to drop them, which raises the precision and location numbers. It also throws away evidence of signs that exist.
Keep them in a separate list of unlocated detections, with the images and approximate positions, and report their count by segment. A cluster of unlocated detections in one area tells the agency where a crew visit or a second pass is worth it. Hiding them makes the inventory look cleaner and less complete at the same time.
Assemblies, posts and duplicates
Agencies maintain signs as assemblies: a post or support carrying one or more panels. An inventory that records panels without their support cannot drive a work order, because crews replace posts and assemblies, not floating panels. Decide in the data dictionary whether the record is the panel, the support or both, and require the link between them.
Assemblies are also where deduplication goes wrong. Two panels stacked on one post, such as a warning sign with a speed advisory plate beneath it, are easy to merge into one record. Two separate posts a few meters apart on the same corner are easy to merge into one assembly. Measure the duplicate rate and the false merge rate separately on the ground truth sample, because they fail in opposite directions and a single combined number hides both.
Write the metrics into the requirement
Most disputes over a delivered inventory come from metrics that were never agreed. Put them in the requirement before collection starts. State the metrics to be reported, the minimum recall and precision for each sign family the agency cares about, the matching radius and facing tolerance, and who collects and holds the ground truth. If the agency holds the ground truth sample itself and does not share it, the vendor cannot tune to it, and the acceptance test means what it says.
Also require the deliverables that make the metrics checkable: the image evidence for every record, the confidence score, the method used to locate each sign, the list of unlocated detections, and the reviewer log. Ask for a pilot section first, evaluated against ground truth in full, before production begins. A pilot that misses its recall target is a cheap conversation. A finished county that misses it is an expensive one.
Questions to ask about any accuracy claim
What was recall measured against?
Independent ground truth from sample segments covering every sign, or a set of images already known to contain signs? Only the first measures what the inventory misses.
What were the matching radius and facing tolerance?
Without them the numbers cannot be checked or compared. A loose radius inflates every metric, especially in dense urban areas.
How do the metrics break down by sign family and condition?
An overall figure dominated by common signs can hide poor performance on the uncommon ones that matter most.
What happened to detections that could not be located?
If they were dropped, ask for the count. It is a direct measure of signs the inventory knows about but does not include.
Frequently asked questions
False records are found and removed the first time anyone checks them. Missing signs are never reviewed because there is no record to look at, so they stay missing until a problem exposes them. Measure recall against independent ground truth before anything else.
Not from daytime imagery. Nighttime imagery with controlled lighting can screen for signs that look dim, but it is not a calibrated measurement. Signs flagged that way should be checked with a retroreflectometer or by trained nighttime inspection before a replacement decision.
Enough sample segments, chosen in advance, to cover the road types and conditions in the full inventory, with every sign in those segments recorded. The sample must be large enough to report metrics by sign family, because overall numbers hide weak spots.
Usually, for location. Signs appear directly in the point cloud, so projecting image detections onto it gives better positions and facing than triangulating from images alone. Imagery remains the main source for sign type and legend.