Two different numbers wearing the same name
There are two scrap measurements in every manufacturing business and they answer different questions. The financial one is a variance: standard cost of what should have been consumed against actual, resolved at close, booked to the P&L. It is correct, it is auditable, and it is close to useless for improvement, because by the time it exists the information about what happened has evaporated.
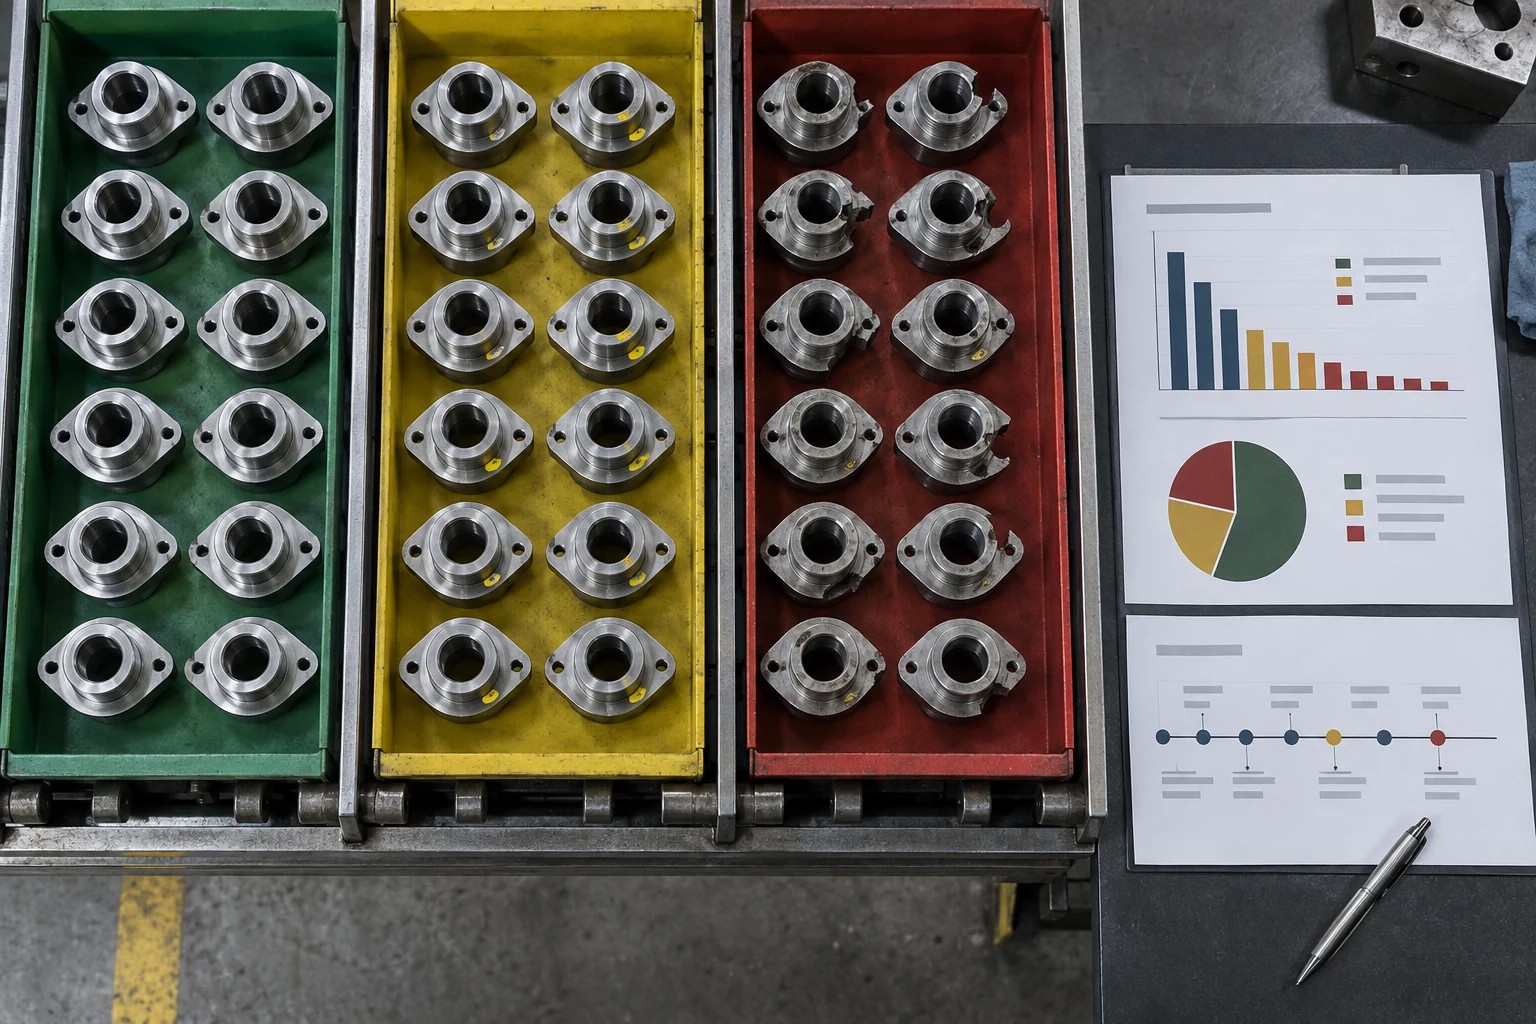
The operational one is an event. A part, at an operation, for a reason, at a time, by a process, on a machine, against a work order. That record is what a Pareto chart is built from and what a corrective action refers to. It is also the one most plants do not have, which is why quality meetings so often circle a percentage nobody can decompose.
You need both, and you need to stop expecting either to do the other's job. The variance tells finance what it cost. The event tells operations what to fix. When the only number is the variance, improvement work gets aimed by anecdote — usually at whichever defect the loudest person saw most recently.

You are probably here because
- The scrap number moves and nobody can say why
- Two departments compute two different scrap rates and both are defensible
- Most of your reason codes resolve to “Other”
- Rework is real, expensive, and appears nowhere in any report
The section on valuing loss at the point it occurred is the one that changes what your plant works on. The section on small counts is the one that stops you chasing noise.
Pieces are the wrong unit
Consider a part with twelve operations. Scrapped at operation ten, it costs you the raw material. Scrapped at operation ninety, it costs the raw material plus eight operations of labor, machine time, consumables and inspection — plus the capacity you cannot recover, which on a constrained line is frequently the largest term and never appears in a cost accounting system.
Report both in pieces and they look identical. Rank your Pareto by piece count and the plant will spend its improvement effort on the high-count, low-value defect at the front of the line while the expensive late-stage failure sits below the fold.
The fix is to value each scrap event at its cumulative cost through the operation where it was lost. You need the routing, standard rates and the operation number — all of which the ERP already holds — and the scrap event has to record where it happened, which is the part usually missing. This single change reorders the improvement list in most plants we have looked at, and it costs nothing but the operation field on the transaction.
Where a line is genuinely capacity constrained, add the minutes. A scrap event at the bottleneck consumes throughput the plant cannot buy back, and expressing that in minutes rather than dollars is often what finally gets the fixture funded.
Rework is the invisible half
Ask a plant what its scrap rate is and you will get a number. Ask what its rework hours are and you will usually get a pause.
Rework frequently is not transacted at all. An operator notices a defect, fixes it at the bench in four minutes, and moves on. Nothing is recorded, because recording it would require finding a screen, choosing a code, and possibly explaining it. The labor shows up, if anywhere, as a variance against standard, attributed to efficiency rather than to quality.
Two consequences follow. The cost of quality is understated, sometimes substantially, because the failures that get repaired quietly are exactly the frequent small ones. And the defect generating the most total labor may be entirely invisible to the improvement program, which only sees defects severe enough to scrap a part.
Capturing rework has to be easier than not capturing it, or it will not happen. In practice that means a single action at the station — scan the traveler, tap a reason, tap done — with the time inferred rather than typed, and no approval step in the operator's path. Approval, if it is needed, happens afterward on someone else's screen. Any design that puts a supervisor between the operator and the record will produce a rework log that reflects supervisor availability rather than rework.
Reason codes people will actually use
Reason code lists fail in two directions and both are common. Too short, and everything lands in “Other” or in whichever code is closest. Too long, and the operator picks the first plausible entry in an alphabetical list of a hundred and forty, which produces data with the appearance of precision and none of the substance.
What works is a list of roughly eight to fifteen codes per process family, written in the words the operators use rather than the words the quality manual uses. “Burr at the flange” beats “dimensional nonconformity.” Map those operator-facing codes upward to whatever standard taxonomy corporate reporting needs; the operator should never see the taxonomy.
Order the list by recent frequency at that station rather than alphabetically, so the common answer is the first tap. Keep a free-text field, expect it to be used sparsely, and read it monthly — that field is where the next code on your list is written, in an operator's own words.
Then treat “Other” as a diagnostic rather than a category. If a fifth or more of events land there, the list is wrong for that station and needs revision. Reviewing the free text and the “Other” share once a month, and actually changing the list, is what keeps the data alive after the first quarter.
The thing that determines data quality, and it is not software
If scrap reporting is used in individual performance reviews, the data will degrade, and it will degrade in a way that is impossible to detect from inside the data. Events go unreported, get attributed to the previous operation, or get coded as machine faults. We would rather say this plainly than have it discovered in month four.
The workable posture is that scrap events describe the process and are used to improve it. Nobody is disciplined for reporting one; people are noticed for finding one early. Whether that holds is a management decision made by the plant manager, not a configuration choice, and it is the single largest determinant of whether any of this produces trustworthy data.
Denominators, and the argument they cause
A scrap rate is a fraction and the argument is always about the bottom half. Started, completed, good output, planned quantity, and gross input are five different denominators. Quality, operations and finance will each pick a different one, in good faith, and produce three numbers that all look wrong to each other.
Fix one definition per metric, write it in a sentence a new supervisor can read, and publish it beside the number. That is a one-page document and it ends a category of meeting permanently.
| Metric | What it actually says | Where it misleads |
|---|---|---|
| Scrap % by piece | How often defects occur | Treats an early and a late loss as equal; over-weights cheap high-volume parts |
| Scrap $ at point of loss | Where the money goes | Needs accurate routings and rates; hides capacity loss on a constrained line |
| First pass yield, per operation | Which operation is unstable | Looks reassuring at every single step while the line total is poor |
| Rolled throughput yield | The chance a unit passes every step untouched | Requires per-operation capture; falls apart if rework is unrecorded |
| Rework hours | The cost of quality nobody books | Almost always understated, because the cheapest fixes go unrecorded |
| Month-end variance | What it cost the P&L | Contains miscount, shrink and timing; cannot be decomposed by cause |
Why every operation looks fine and the line does not
First pass yield measured at a single operation is comforting. Rolled throughput yield — the product of first pass yields across the whole routing — is the number that matches what people experience.
Take twelve operations, each running 98 percent first pass yield. Every station reports a good number and every supervisor is defensible. The probability that a unit passes all twelve without intervention is 0.98 raised to the twelfth power, which is about 78 percent. Roughly one unit in five needs somebody to touch it, which is exactly what the floor will tell you and exactly what the operation-level report denies.
That arithmetic is worth putting in front of a leadership team once. It explains why a plant can hit every station-level target and still miss delivery, and it reframes improvement from “which station is bad” to “how many touches does a unit require,” which is a better question.
Which change usually moves the number — our read
Our judgment of which changes tend to move the number, not a survey. The bottom row is the one most often proposed first.
Small counts, and the reports that manufacture panic
Here is a pattern worth recognizing. A line makes 200 parts a day at a 1.5 percent scrap rate. That is three events a day. A weekly report shows 21 one week and 29 the next, the cell turns red, and somebody is asked to explain a 38 percent increase.
There is nothing to explain. With counts that small, that movement is ordinary variation, and treating it as a signal produces a specific and costly failure: the plant investigates noise, finds a plausible story every time, changes something, and the number returns to its mean regardless. Everyone concludes the change worked. The organization learns to trust an explanation-generating process rather than a measurement.
The discipline is ordinary control-chart thinking. Plot the rate over enough periods to see the natural band. React when a point falls outside that band or when a run of points trends in one direction, not when a single week is higher than the last. With rare events, aggregate to a longer period or to a family of parts until you have enough count to see anything at all — and accept honestly that for a low-volume line, a month may be the shortest interval that carries information.
The right response to a single bad day is usually to record it well and do nothing else.
Reconcile, and track the gap
Once operational scrap events exist, sum them for the period and compare against the financial variance. They will not match. They never match.
The gap is the interesting number. It contains unreported scrap, miscount, unrecorded rework, material issued and never returned, standards that are wrong, and genuine shrink. A plant whose reported events explain most of the variance has a measurement system it can act on. A plant where they explain a small fraction has a reporting habit, not a measurement system.
Track that percentage monthly and watch its direction. It improves as capture discipline improves, and it is a far better indicator of whether this work is succeeding than the scrap rate itself — which, uncomfortably, often goes up for the first few months of an honest capture program, because you are now counting things you were not counting before. Say that out loud before you start, to the person who will see the chart.
Where you do not need us
If your ERP or quality system has a nonconformance module that was purchased and never configured, that is the cheapest path and it stays supported through upgrades.
If nobody has written down the denominators, do that first. It is one page, it needs a decision rather than an engineer, and half the disagreement usually disappears with it.
If your volumes are genuinely low — a few hundred units a month — a paper tally at each station, entered weekly, will give you an actionable Pareto within a quarter for the cost of a clipboard. Software adds precision you do not yet need on top of counts too small to support it.
Where an outside team is worth it is when the events exist across several systems that disagree, when the routing and rate data needed to value losses lives somewhere the quality system cannot reach, or when the capture has to happen at the station in under ten seconds and nothing you own can do that.
The mistakes that repeat
- Reporting scrap in pieces, which puts improvement effort at the front of the routing
- No operation number on the event, so the loss cannot be valued or located
- Rework left untransacted, hiding the most expensive defect in the plant
- A reason code list written by the quality department rather than by the people using it
- Tying scrap reporting to individual performance, which corrupts the data invisibly
- Reacting to week-over-week movement in counts too small to carry a signal
- Three denominators in three departments, and a standing argument about arithmetic
- Never reconciling events to the financial variance, so nobody knows what share is explained
A sequence that works
- Write the definitions first — scrap, rework, the denominator for each metric — on one page, signed
- Add the operation number to every scrap and rework event before anything else
- Value events at cumulative cost through that operation, using routings you already have
- Design the capture to take under ten seconds, with no approval in the operator's path
- Write eight to fifteen reason codes per station in the operators' own words
- State the no-blame posture explicitly, from the plant manager, before go-live
- Plot with a control band and agree in advance what triggers an investigation
- Reconcile monthly to the variance and publish the explained share, not just the rate
Bottom line
A scrap number pulled from a month-end variance cannot tell you what to fix, and no dashboard built on top of it will change that. Capture the event instead, put the operation number on it, value it at what had been spent by the time it was lost, and make rework as easy to record as it is to perform. Then protect the data by keeping it out of individual performance reviews, and protect your attention by refusing to investigate movement that small counts cannot support. The measurement work is a few weeks. The definitions are one page. Almost everything hard about this is agreement, not engineering.
Frequently asked questions
Almost certainly not. You are now counting events that previously went unrecorded, so the measured rate rises while the actual loss is unchanged or falling. Say this to leadership before you start, and track the share of the financial variance your events explain alongside the rate — that number rising is the evidence the program is working.
Roughly eight to fifteen per process family, written in operator language and ordered by recent frequency rather than alphabetically. Keep a free-text field and read it monthly, because that is where your next code is already written. If more than about a fifth of events land in “Other,” treat that as a signal the list is wrong for that station rather than as a category.
Only if the weekly count is large enough to carry a signal. A line producing three scrap events a day will show swings of thirty or forty percent week to week from ordinary variation, and investigating those produces a plausible story every time regardless of cause. Use a control band, react to points outside it or to sustained runs, and for low volumes aggregate to a month.
Make recording it faster than avoiding it: one scan, one tap for the reason, time inferred rather than typed, and no supervisor approval in the operator's path. Then make it safe — if rework counts appear in individual reviews, the log will measure willingness to report rather than rework. Approval and review can happen afterward, on somebody else's screen.
Usually not as the first move, because the constraint is nearly always capture and definitions rather than analysis. Fix the operation field, the valuation, the reason codes and the denominators, and a plain report will show you the Pareto. Revisit the platform question once you have a year of trustworthy events and a specific analysis your current tools cannot perform.