
The sorted list that everybody already has
Every company that ranks anything by risk started the same way. Someone in operations knew which signals mattered. They wrote seven of them into a spreadsheet, gave each a weight between one and five, summed the products, and sorted descending. The top of that list was better than the bottom, the analysts agreed it looked right, and it went into a product. Years later there is an API in front of it, a dashboard behind it, a customer contract that references the score, and a director who has been asked to explain how the number is produced.
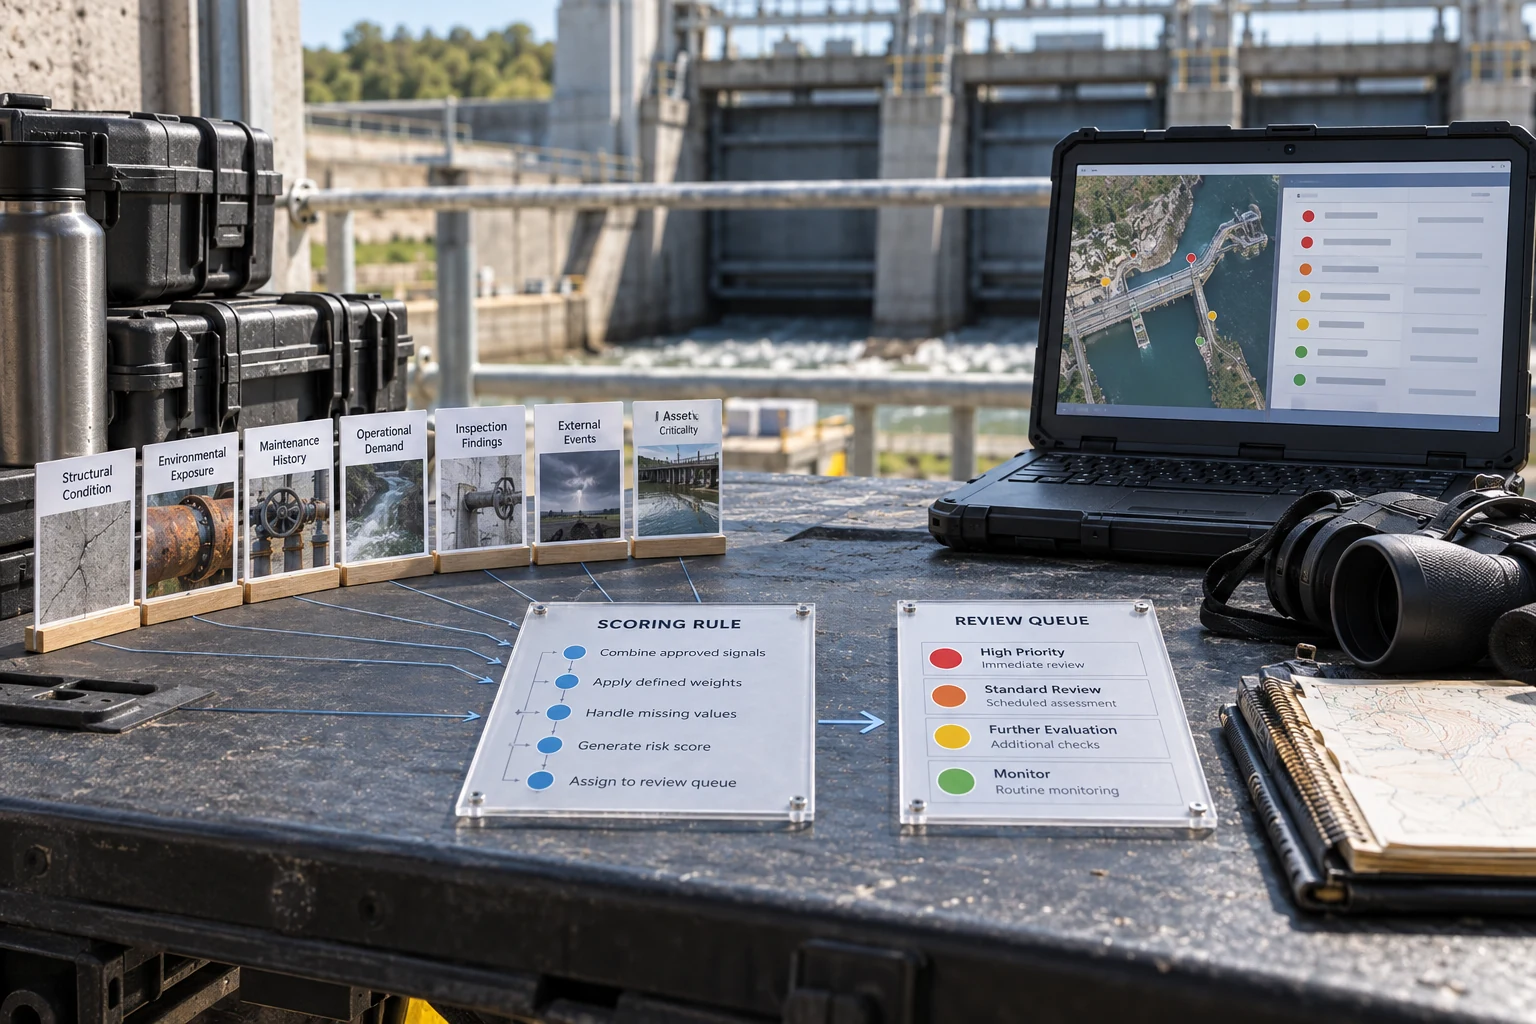
The weighted sort was a reasonable thing to build. It encoded real expertise, shipped in a week, and beat no ranking at all. The problem is not that it was wrong. It is that nothing about it can tell you whether it is still right, and the organization has since started making decisions that assume it is.
A sorted list and a risk model produce the same artifact: an ordered set of entities with a number attached. The difference is not the algorithm. You can build a defensible risk model with logistic regression on nine features and an indefensible one with a gradient-boosted ensemble on four hundred. The difference is everything around the score. A model knows what population it applies to, what fraction of bad outcomes it caught, how its number maps to a real rate, and what happens where somebody acts. A sorted list knows none of that and has nowhere to store it.
What is missing when a ranking cannot be defended: our ranking from build and rescue work
Relative frequency in our own build and rescue work, not a survey. The bottom row is where teams look first.
The denominator is the whole argument
Ask any team what their risk ranking achieves and you will hear a numerator. Of the two hundred cases the model flagged last quarter, sixty-one turned out to be real. That is a 30 percent hit rate and it sounds like performance. It is not performance, because it says nothing about the cases the ranking did not flag. If four hundred bad outcomes occurred in the same quarter, the ranking found 15 percent of them and the other 339 arrived through complaints, audits, losses, and phone calls.
This is the most common gap we find, and it is not a statistics problem. It is a data-collection problem with a statistics symptom. Nobody built the pipeline recording outcomes for entities scored low, because nobody investigates them, so no label comes back. The system is structurally incapable of learning it is wrong, and it has been running for four years.
Two mechanisms fix it, and both cost money on purpose. The first is a random audit stratum: a small sample drawn from below the cutoff and worked exactly like a flagged case, typically 1 to 3 percent of the low-score population. It feels like waste. It is the only unbiased estimate of what you are missing, and it is what makes a recall number real instead of rhetorical. The second is a delayed-truth pipeline that joins to outcomes arriving later from other systems: chargebacks, warranty claims, adverse events, defaults, incident reports. Those labels land weeks or months after the score, so the join has to be built once and left running.
With a denominator you can finally state performance the way a buyer or a reviewer wants to hear it. Not "our score is accurate." Rather: at our current cutoff we review 4 percent of the population, that 4 percent contains 61 percent of realized bad outcomes, and a case in the top decile is 14 times more likely to go bad than one in the bottom half. Every number in that sentence is checkable, and none of them can be produced by a sorted list.
Rank order and probability are different products
A ranking answers which case to look at next. A probability answers how likely this specific case is to be bad. Teams build the first and then let the business use it as the second, and that substitution causes more damage downstream than any modeling choice.
It shows up when someone prices off the score, sets a reserve against it, reports it to a customer as a likelihood, or writes it into a contractual threshold. A score of 850 out of 1000 sounds like 85 percent. It usually means the entity sits in the top 3 percent of a distribution whose absolute rate might be 2 percent or 40 percent, depending on the base rate that day. Discrimination and calibration are separate properties: a model can rank beautifully and still be numerically meaningless.
If the number leaves your team, calibrate it. Isotonic regression or Platt scaling on a held-out set, fit on the population the model actually serves, refit on a schedule. Then measure it and publish the measurement: a reliability curve with observed rate against predicted rate per bucket, an expected calibration error, and a Brier score alongside whatever AUC you have been quoting. If you decide not to calibrate, then say the score is a rank and design the interface so it cannot be mistaken for anything else. Deciles and letter bands do that. A three-digit number with two decimal places does the opposite.
The cutoff is a business decision that keeps getting made by accident
Where the ranking becomes a decision is the threshold, and in most companies that number came from staffing. The team can work 300 cases a week, so the cutoff is wherever the 300th case falls. Nobody wrote that down as a policy and nobody revisits it when the population grows 40 percent.
The honest way to set it is to price both errors. What does a missed bad case cost, in loss, in remediation, in regulatory exposure, in a customer relationship. What does a false positive cost, in analyst hours, in a wrongly-declined customer, in a needless inspection. Put both on the precision-recall curve and the threshold stops being a capacity artifact and becomes a defensible choice with an owner and a date.
Two refinements pay for themselves quickly. First, a band instead of a line: a clear-action zone at the top, a clear-ignore zone at the bottom, and a middle band routed to cheaper treatment such as an automated check. Populations are far easier at the extremes than in the middle, and forcing one boundary to serve all three regions wastes the easy decisions. Second, store the threshold inside the model's version record, not in a config map anyone can edit at midnight. A threshold change is a model change, and if you cannot tell which was in force in March, you cannot reconstruct any decision made that month.
Stability is a property you have to test for
A ranking is used by people, and people notice churn before they notice error. If the same unchanged entity moves from rank 12 to rank 340 on Tuesday because an upstream table reloaded, your analysts learn within a month that the list is not to be trusted, and no amount of AUC recovers that.
Rank stability is measurable and almost nobody measures it. Score twice on genuinely unchanged inputs and compare: the order should be identical, not merely close. Then run consecutive days on the real population and see how much of the top decile persists. Some turnover is the system working. A top decile that turns over 70 percent overnight with no external event is either an upstream data problem or a model too sensitive to a feature that jitters.
The usual causes are boring and fixable. A feature that depends on a rolling window recomputed against a table that backfills. A missing value that silently becomes zero when the source is late, which pushes an entity to an extreme instead of the middle. A tie-breaking rule that is nondeterministic, so hundreds of equal scores shuffle every run. Each has an engineering fix: a point-in-time feature store with an as-of join, explicit missingness handling with a tested default, and a deterministic tiebreaker on a stable key.
Where the budget goes on a first defensible ranking build: weight by effect on the outcome
Our weighting from project planning, not a survey. The last row is where a rebuild usually starts and where the least score movement lives.
Backtesting a ranking without lying to yourself
The standard evaluation split will flatter a risk ranking badly, because risk data is temporal and entities repeat. A random split puts March and June in the same fold and lets the model see the future. Worse, the same customer, facility, or supplier appears in both training and test, so the model memorizes the entity rather than learning the risk.
Three rules fix most of it. Split on time, training on an earlier window and testing on a later one, then walk the window forward and report the sequence rather than a single number. Group by entity so no identifier crosses the boundary. Match the label horizon to the decision: if you act today on something that resolves in ninety days, your test set must be built with a ninety-day gap, or you will be scored on outcomes you could not have known.
Then check the features for leakage, which is where most implausible results come from. Any field written after the outcome was known, a case-status column, an investigator note, a closure code, an adjustment flag, will hand you an AUC of 0.97 and collapse in production. The practical test is to write down, for every feature, the moment it becomes available relative to scoring time, and delete anything you cannot defend. This is tedious and it is the single highest-yield hour in the whole build.
Finally, always report a naive baseline next to your model. Sort by exposure, by size, by recency, by count of prior events. If a one-line ordering rule gets within a few points of the ensemble, that is not a failure. It is the most useful fact of the project, because it tells the business what the machine learning is actually buying and whether the maintenance is worth it.
When the score touches a person
The obligations change the moment a rank affects a person rather than a machine or a shipment. If the ranking influences credit, employment, housing, insurance, or benefits, explanation stops being a courtesy. Adverse action rules under the Equal Credit Opportunity Act and Regulation B require the specific principal reasons, and the CFPB has stated plainly that model complexity is not an exemption. New York City Local Law 144 has required an annual independent bias audit of automated employment decision tools since July 2023, and the NAIC model bulletin on insurer use of artificial intelligence, adopted December 2023 and issued by most states, asks for a written governance and testing program.
The engineering consequence is that reasons must be produced by the scoring path at scoring time and stored with the decision, not reconstructed later by an explainer running against a rebuilt feature vector. Post-hoc attribution drifts from what actually happened, and the drift is invisible until someone compares a stored decision against a notice and finds they disagree. Map contributions to a fixed reviewed vocabulary, version that vocabulary, and store the version with the record.
Disparate impact testing belongs in the same pipeline rather than in an annual consulting deliverable. Selection rates and impact ratios computed monthly against production decisions, written to a table, method documented once. As a pipeline it costs a few weeks and answers instantly thereafter. As a study it gets bought again every year, and each year's numbers are slightly incomparable to the last.
Governance vocabulary, and how much of it you actually need
Three reference texts cover almost every conversation. SR 11-7, the 2011 Federal Reserve and OCC guidance also issued as OCC Bulletin 2011-12, defines a model as any quantitative method turning inputs into an output used in a decision, which sweeps your weighted spreadsheet squarely into scope. Its two risk sources, the model can be wrong and the model can be used wrong, are worth adopting even if no examiner ever visits. The NIST AI Risk Management Framework, released January 2023, is free and voluntary and carries the govern, map, measure, manage vocabulary federal buyers recognize. ISO/IEC 42001:2023 is the certifiable one, for when a customer wants third-party attestation rather than your own documentation.
Cost is the part nobody states. NIST AI RMF alignment is documentation work: several weeks per consequential system if the underlying record exists, and far more if it does not, which is the real reason it feels expensive. An accredited ISO 42001 certification commonly runs in the tens of thousands of dollars for the initial two-stage audit plus annual surveillance, with internal preparation the larger number and six to twelve months realistic from a standing start. Where the ranking is driven by a language model or an agent, the OWASP Top 10 for LLM Applications and the MITRE ATLAS threat matrix supply the attack vocabulary general frameworks do not carry.
If the buyer is a federal agency or a prime selling into one, a separate stack applies on top: NIST SP 800-53 controls carry the authorization, SP 800-171 governs controlled unclassified information on your own systems, and FedRAMP governs cloud services sold to agencies. That layer is about where the system runs and who may operate it. A perfectly validated ranking hosted somewhere the customer cannot authorize does not ship, and the sequencing of those two workstreams is worth planning before either starts.
The record that makes the rest of it real
All of this collapses without a place to store the evidence. Given a decision made on a date, you should be able to recover the exact inputs as they stood then, the model version, the threshold in force, and reproduce the same output. That requires point-in-time feature storage rather than a live query against current tables, content-addressed model artifacts rather than a path that gets overwritten, and thresholds carried inside the version record. We wrote the schema in a model registry that earns its keep, and the governance framing in model risk management for companies that are not banks.
The reason to build it is not compliance. It is that a ranking without a reproducible record cannot be improved. Every proposed change becomes an argument between people with opinions, because there is no way to ask what the new version would have done on last year's cases. With the record, a change is a measurement: rerun the candidate over a historical window, compare recall at the same review capacity, look at which cases moved and read twenty of them. That loop is what turns a static list into a system that gets better, and it is the difference the director in the meeting is actually buying.
What a rebuild looks like in practice
The order matters more than the tooling. Start with outcomes, because without labels nothing downstream can be measured, and the audit stratum takes a full quarter to produce enough signal to be worth anything. In parallel, freeze the current ranking as a documented baseline: its features, its weights, its threshold, its behavior on a historical window. That baseline is what every future version gets compared against, and teams that skip it lose the ability to prove any improvement at all.
Then the feature layer with as-of joins, then a candidate model evaluated against the frozen baseline on time-blocked splits, then the calibration layer if the number leaves the team, then the threshold and band policy priced against both error costs, then monitoring with named thresholds and a named owner for each alert. A typical first build on this shape runs three to six months of dedicated engineering alongside the modeling itself. Done as remediation under a customer or supervisory deadline, the same work costs roughly three times as much and produces a worse system, because the sequencing gets driven by the deadline instead of by the dependencies.
What the organization gets is not a better sorted list. It is the ability to answer, without a meeting, what the ranking catches, what it misses, what the number means, what happens at the boundary, and what changed since last quarter. Those five answers are the product. The score is where they surface.
Bottom line
The distance between a sorted list and a risk model is not measured in algorithms. It is measured in whether you paid for a denominator, whether the number is calibrated or honestly labeled as a rank, whether the cutoff was chosen or inherited from staffing, whether the order is stable, and whether any past decision can be reproduced. Buy those five things and a simple model will outperform a sophisticated one that has none of them, in production, in a review, and in front of a customer who asks how the number is made.
Frequently asked questions
Under the SR 11-7 definition, yes. A model is any quantitative method that turns input data into an output used to make a decision. That covers spreadsheets, rules engines, and neural networks on equal terms, and reviewers apply it that way.
Sample below the cutoff and work those cases the same way, typically 1 to 3 percent of the low-score population, and join to outcomes that arrive later from other systems. Without one of those two mechanisms, recall cannot be estimated and any hit rate is unanchored.
If the number leaves your team, yes, because everyone downstream will read it as a rate. If it stays internal and drives only work order, publish it as deciles or bands so it cannot be mistaken for a probability. The failure mode is publishing an uncalibrated three-digit number.
From the relative cost of a miss and a false positive, read off the precision-recall curve, recorded as a dated policy with an owner. Review capacity is a real constraint but it should be an input to that decision rather than the whole of it.
Three to six months of dedicated engineering for a first consequential system, with the outcome pipeline starting first because it needs a quarter to produce useful signal. The same work done as remediation under a deadline costs roughly three times more.