
What a knowledge graph actually is
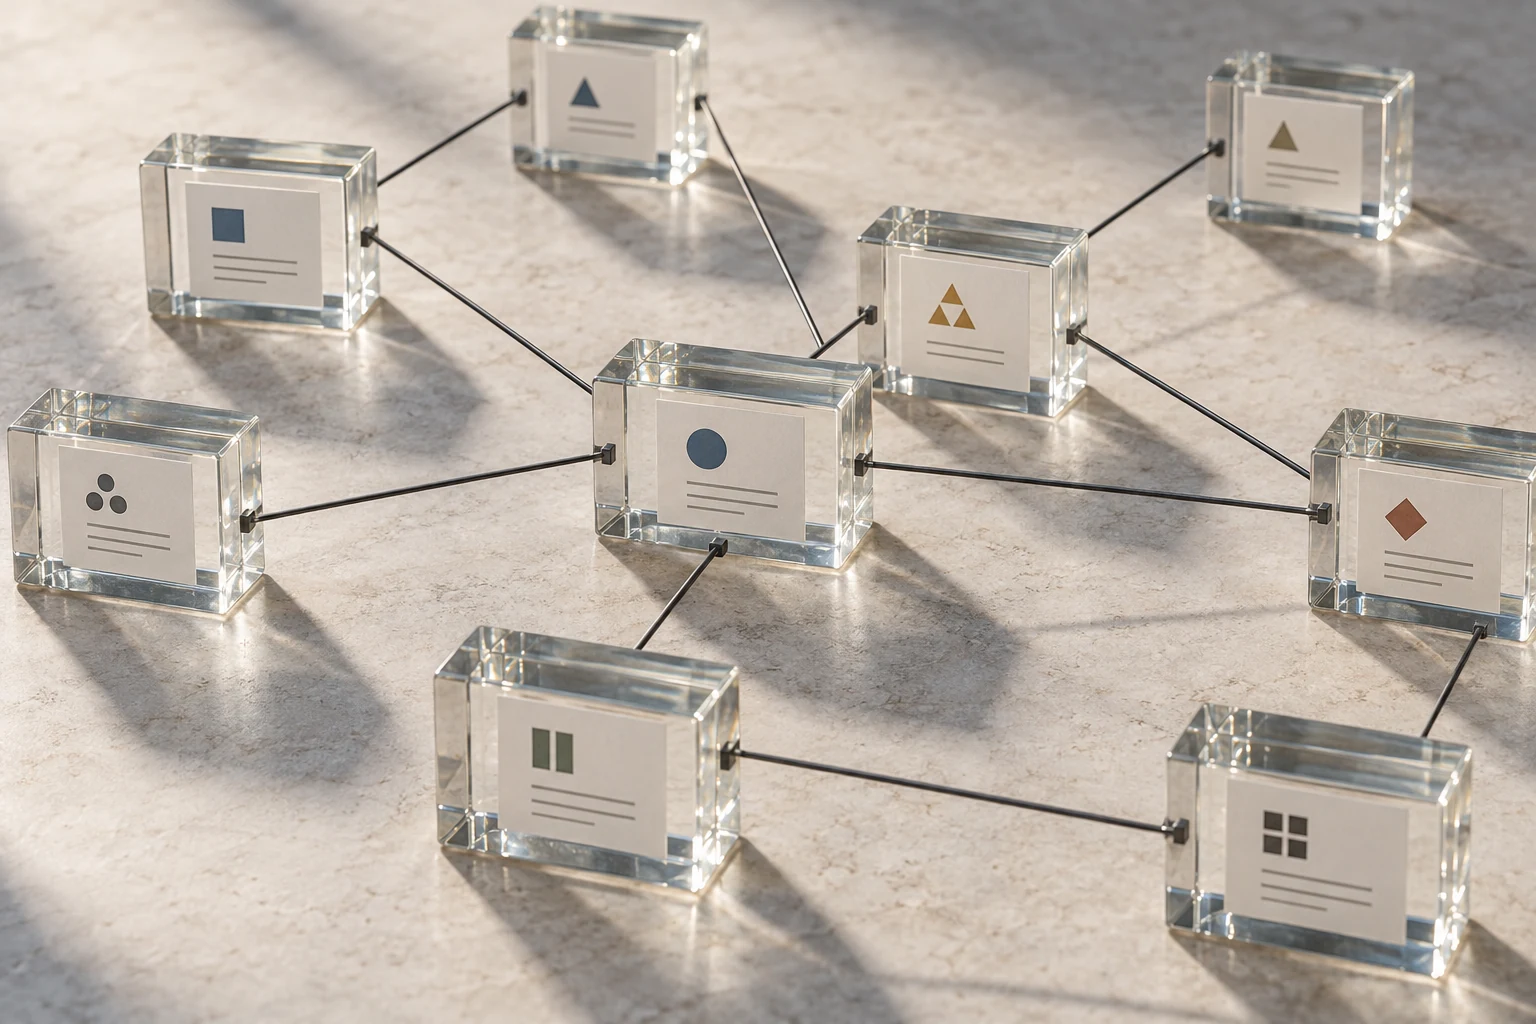
A knowledge graph is three things held together: a set of entities, a set of typed relationships between them, and one identity scheme that both agree to obey. That is the whole definition. Entities are nodes, relationships are edges, and the identity scheme is the part every team underestimates. It also decides whether the graph is still useful in year two or quietly abandoned in month five. Two engineers who agree on what counts as the same organization build something durable on almost any engine; two who never settle that question produce an expensive tangle on the best engine money can buy.
The vocabulary predates the current wave of interest. RDF reached W3C Recommendation status in its 1.1 form in 2014, SPARQL 1.1 in 2013. The labeled property graph model arrived through implementations rather than standards and only recently caught up: ISO/IEC 39075:2024 published GQL, the first new ISO database query language since SQL, and ISO/IEC 9075-16:2023 added SQL/PGQ so graph pattern matching runs inside an ordinary SQL engine. That last one changes the build-versus-move calculus more than most teams have noticed.
When a graph beats a table
Relational databases model relationships perfectly well. A foreign key is an edge. The real question is what the query costs, and what the schema does when relationship types multiply. Three conditions push the answer toward a graph.
Variable-depth traversal. The question is "who supplies the supplier of my supplier," and the depth is not known in advance. In SQL that is a recursive common table expression with termination logic that grows unreadable past three levels; in a graph language it is one bounded pattern. Supply-chain screening under FAR 52.204-25 and NIST SP 800-161r1 has exactly this shape, since covered equipment does not announce itself at tier one.
Sparse, heterogeneous relationship types. With forty kinds of connection and any given entity in four of them, a relational schema either grows forty join tables or collapses into a generic key-value table that defeats the optimizer. A graph absorbs the variety without a migration per new type.
Relationships that carry data. An edge with a start date, an ownership percentage, a confidence score, and a source citation is a first-class object. Modeling that relationally is possible and always ends in an association table nobody enjoys maintaining.
Problem classes where a graph earns its keep
Editorial weighting from public sources and practitioner reading — illustrative, not a measured statistic.
The four decisions that are expensive to reverse
Everything else can be rewritten in a sprint. These four cannot, because they are baked into every loaded row and every downstream query.
The identity scheme. What makes two records the same thing, who arbitrates, and what happens when the arbiter is wrong. Reversing it means reloading everything.
The model. RDF with global URIs, a labeled property graph with local identifiers, or graph patterns inside the relational store you already run. Each drags a different toolchain behind it.
Whether edges carry provenance. Adding source, method, and timestamp on day one costs perhaps fifteen percent more storage. Adding it in month nine means re-deriving the whole graph, because the origin information is gone.
Where the graph sits relative to the system of record. A derived view rebuildable from source in hours is a different asset from a graph that became authoritative because someone started editing it directly.
| Model | Strongest at | Query surface | Where it hurts |
|---|---|---|---|
| RDF triples | Merging data from parties who never coordinated; global identifiers; published vocabularies | SPARQL 1.1, SHACL for validation | Verbose, slower on deep traversal, small talent pool |
| Labeled property graph | Deep traversal, edge attributes, graph algorithms at scale | Cypher / openCypher, Gremlin, GQL | No portable schema standard; vendor lock is real |
| Relational + SQL/PGQ | Keeping one copy of the data; existing backups, roles, audit | SQL:2023 Part 16 pattern matching | Engine support still uneven; deep traversal costs more |
| Vector index | Fuzzy similarity over text and images | Approximate nearest neighbor | No structure, no constraints, no explainable path |
Identity is the whole game
Entity resolution decides the quality of everything above it. Federal identifiers help where they exist and mislead where they do not. SAM.gov retired DUNS for the Unique Entity ID on April 4, 2022, so any dataset spanning that date carries two identifier regimes for the same organizations. GLEIF has issued well over two million Legal Entity Identifiers, covering financial counterparties and missing most small suppliers. Health data has the NPI. Everything else is name, address, and judgment.
The pipeline is standard: blocking to cut the candidate space, pairwise scoring, then clustering. The danger sits in the last step, because transitive closure over pairwise matches is unforgiving. At a one percent false-merge rate across ten million candidate pairs, one hundred thousand wrong links enter the graph, and merge being transitive, they pull unrelated clusters into blobs. One bad edge can fuse two large organizations into a node that poisons every rollup, count, and reachability query touching it. Cluster-size distribution is the tell: if the largest resolved entity holds forty thousand source records and the second holds nine, the pipeline has already failed and nobody has noticed.
For that reason we treat resolution as its own deliverable with its own acceptance numbers, separate from the graph build. Our piece on entity resolution across datasets you do not own covers the mechanics.
Schema: reuse before you invent
The instinct to design a fresh ontology is strong and usually wrong. Published vocabularies already cover most federal domains, carry community maintenance, and make your data legible to the next contractor. NIEM, now stewarded as an open project at OASIS, covers justice, emergency management, and immigration exchanges. HL7 FHIR at release R5 already models clinical entities and their references as a graph. SNOMED CT carries more than 350,000 active concepts, FIBO covers financial instruments and legal entities, PROV-O covers provenance, and DCAT version 3 covers the dataset catalogs behind data.gov-style inventories.
Take what you need and extend at the edges. The matching restraint: OWL 2 reasoning is almost always more machinery than the problem requires, while SHACL is almost always exactly right. Most teams want validation ("every award must have a funding agency and a period of performance") rather than inference, and SHACL gives that as a pass/fail check in CI.
Provenance, and the federal questions a graph raises
Every edge should carry four fields: source, method, timestamp, and the producer's confidence. This is not documentation hygiene. It is the difference between a finding you can defend and one you cannot.
Linking records about people across systems also triggers law, and the linking itself is the trigger. The Privacy Act of 1974 (5 U.S.C. 552a) governs records retrieved by personal identifier, and a graph that joins two agency systems can constitute a new system of records requiring its own notice. The Computer Matching and Privacy Protection Act amendments add another layer: computerized matching of federal personnel or benefit records generally requires a written matching agreement and review by the agency's Data Integrity Board. On the health side, 45 CFR 164.514 defines de-identification, and increasing linkage is precisely how de-identified data becomes re-identifiable. Ask the privacy question during modeling, when the answer is a design choice, rather than at security review, when it is a rebuild.
Grants work has the same shape. Pass-through entities carry subrecipient monitoring obligations under 2 CFR 200.332, and subawards at or above $30,000 carry reporting duties under 2 CFR Part 170. The prime-to-sub-to-sub structure is a graph whether or not anyone stores it as one.
Evaluation: what "good" means as a number
Projects drift because nobody set a number. Four layers, each with its own measurement.
Structural validity. SHACL shapes run in CI on every load. Target zero violations on shipped constraints, and trend violations per ten thousand nodes over time. A rising number means an upstream source changed and nobody told you.
Edge quality. Sample and hand-label. A working bar: precision at or above 0.95 for edges that drive a decision, 0.85 for edges that drive a suggestion to a human. Recall is measured against a curated gold subgraph. Report both together, because a graph at 0.99 precision and 0.20 recall is confident and mostly empty, and it passes any review that asks only about accuracy.
Resolution quality. Pairwise precision and recall plus cluster-level B-cubed metrics. Pairwise numbers alone hide the blob failure above; cluster metrics expose it.
Task effect. Link-prediction leaderboards report Hits@K and mean reciprocal rank, fine for model selection and useless as delivery evidence. The delivery metric is whether the graph changed an answer: questions answerable now that were not before, analyst minutes per investigation, findings caught before submission rather than after. If the graph cannot move one of those, it is a hobby.
Failure modes teams hit
- The modeling committee. Nine months of ontology design, no data loaded, a class hierarchy nobody outside the room can read.
- The blob. Over-merged entities from unbounded transitive closure, discovered when a count comes back absurd.
- Supernodes. One node with four million edges. Every planner estimate goes wrong; every traversal touching it times out.
- Extraction without measurement. Model-extracted triples loaded at scale and never sampled, so the error rate compounds unseen.
- The second copy. The graph drifts from the system of record because nobody owns the reconciliation job.
- Schema by accident. Four hundred edge types, half of them synonyms, none documented, all in production queries.
- Algorithms that do not scale. Betweenness centrality is roughly O(V·E), comfortable at 100,000 nodes and impossible at 100 million.
- No deletion story. Sources retract records, the graph never forgets, stale edges accumulate as quiet errors.
Production: latency, cost, monitoring
Separate the two workloads on day one. Transactional traversal (one to three hops for a specific user question) should return in tens of milliseconds against a warm working set. Analytic work (PageRank, Leiden community detection, connected components) is a batch job measured in minutes and belongs on ephemeral compute, not the cluster serving queries. Teams that run both on one cluster discover the conflict during a demo.
Put hard bounds on every production traversal: a maximum hop count, a query timeout, and a degree cap that refuses to expand past a threshold. Unbounded variable-length traversal in a user-facing path is an outage with a delay fuse, and the bound returns a clean error instead of a hung request.
Cost follows memory rather than disk. Adjacency structures want RAM, so the sizing question is working-set size, not total triples. A highly available managed cluster provisioned for a few hundred million edges is a five-figure annual line item before anyone writes a query, which is why an honest comparison against the table the customer already pays for deserves a hearing. Where analytics are periodic, running them on transient compute cuts standing cost sharply.
Monitor distributions, not just errors: node and edge counts by type per load, p99 node degree, orphan rate, SHACL violations, resolved-cluster size distribution, query latency by pattern shape, and staleness against the source system. Alert on shift. A load that adds thirty percent more edges of one type than the last run is either a real upstream event or a broken parser, and you want to know which within the hour.
Where language models fit
Models are good at proposing structure from text and bad at guaranteeing it. Extracting candidate entities and relationships is genuinely faster with a model in the loop, provided every batch is sampled and scored before it is trusted. Microsoft Research open-sourced GraphRAG in 2024, and the pattern it popularized (build a graph from a corpus, detect communities, summarize them, answer global questions over the summaries) helps on theme-level questions that plain retrieval handles badly. Indexing is expensive, so it suits stable corpora better than churning ones.
The pairing that holds up in production is narrow: the graph carries structure, identity, and constraints; the vector index carries text similarity; the model writes prose and cites specific edges a reviewer can open. Our piece on why retrieval is the wrong tool for structured data covers the other half of this boundary.
When a simpler method is the right answer
Often. The thresholds we apply before recommending a graph at all:
Under roughly ten million rows with questions two joins deep. PostgreSQL, properly indexed, is faster to build, cheaper to run, and easier to hire for.
Fixed hierarchy of known depth. A closure table or materialized path column answers ancestor and descendant queries in one indexed lookup.
High-volume single-hop lookups. A key-value store or denormalized wide row beats any graph engine on throughput and cost.
Similarity rather than structure. If the questions are about resemblance and not connection, a vector index is the right instrument and a graph adds nothing.
Identity still unsettled. A graph on unresolved identities is worse than a table on the same identities, because it propagates the error across hops and makes it look authoritative.
We would rather ship the boring answer that holds for five years than the impressive one that decays after the demo. When our engineers recommend a graph, it is because traversal depth is variable, relationship types are heterogeneous, or provenance is required per edge. Those cases are real and we build them through to production. They are simply not every case, and a firm that says otherwise is selling an engine rather than solving a problem.
Bottom line
Get identity right, put provenance on every edge, set numeric acceptance criteria before the first load, bound every production query, and keep the graph derivable from a system of record you do not own. Do those five things and the engine choice stays reversible, which is the objective. Skip them and the most capable graph database available still produces something nobody trusts by the second quarter.
Common questions we get on scoping
Our data is too messy for a graph. Should we clean it first?
Clean identity first, everything else second. Attribute noise is tolerable because attributes can be corrected in place; identity errors are structural and propagate across every hop. A short resolution engagement with its own precision and recall targets, run before any modeling, is the highest-value sequencing we know.
Can a language model just build the graph for us?
It can propose a large fraction of it. It cannot certify it. Treat model output as candidate edges carrying a confidence score and a sampling plan, hold them to the same precision bar as any other source, and keep the extraction prompt and model version in the provenance record so a finding can be reproduced.
Do we need a full-time ontologist?
Rarely at the start. Adopting an existing vocabulary (NIEM, FHIR, FIBO, DCAT) and extending it narrowly removes most of the modeling work. Dedicated modeling capacity earns its place once several organizations contribute data and the vocabulary becomes the negotiated artifact.
Can this run in an air-gapped or high-impact-level enclave?
Yes. RDF stores and property-graph engines run entirely on-premise with no outbound calls, and the images can be hardened to the applicable STIG. The parts that usually need rework are the extraction step, if it called a hosted model, and the monitoring stack, if it shipped telemetry outside the boundary.
Frequently asked questions
A graph database is storage and query technology. A knowledge graph is a modeled body of entities and relationships with a governed identity scheme and provenance on every edge. You can hold one in a relational database using SQL/PGQ, and you can fill a graph database with data that is not a knowledge graph at all.
Size is the wrong trigger; traversal depth and relationship variety are. Ten million rows with two-join questions belong in PostgreSQL. Two million rows with variable-depth ownership questions across thirty relationship types are a good graph candidate.
Choose RDF when data arrives from parties who never coordinated and global identifiers plus published vocabularies carry real value. Choose a property graph when traversal depth, edge attributes, and algorithm performance dominate. GQL (ISO/IEC 39075:2024) narrowed the portability gap that used to argue against property graphs.
Four layers: SHACL conformance for structure, hand-labeled precision and recall on sampled edges, pairwise plus B-cubed cluster metrics for resolution, and a task-level measure showing the graph changed an answer or a decision time. Report all four; any single one can be gamed.
Memory drives the bill, since adjacency structures want to be resident. A highly available managed cluster sized for a few hundred million edges is typically a five-figure annual line item before query volume. Moving batch analytics onto transient compute is the largest cost lever.