
Three questions, and a diagram answers one
Lineage projects are usually bought as a picture. A tool is licensed, it crawls the warehouse, it produces a graph of boxes and arrows, and everyone is pleased with how it looks on a screen. Then someone points at a figure in last quarter's reporting pack and asks where it came from, and the graph says that the table it lives in was built from eleven other tables. That is true, it is not an answer, and the distance between those two is the entire subject.
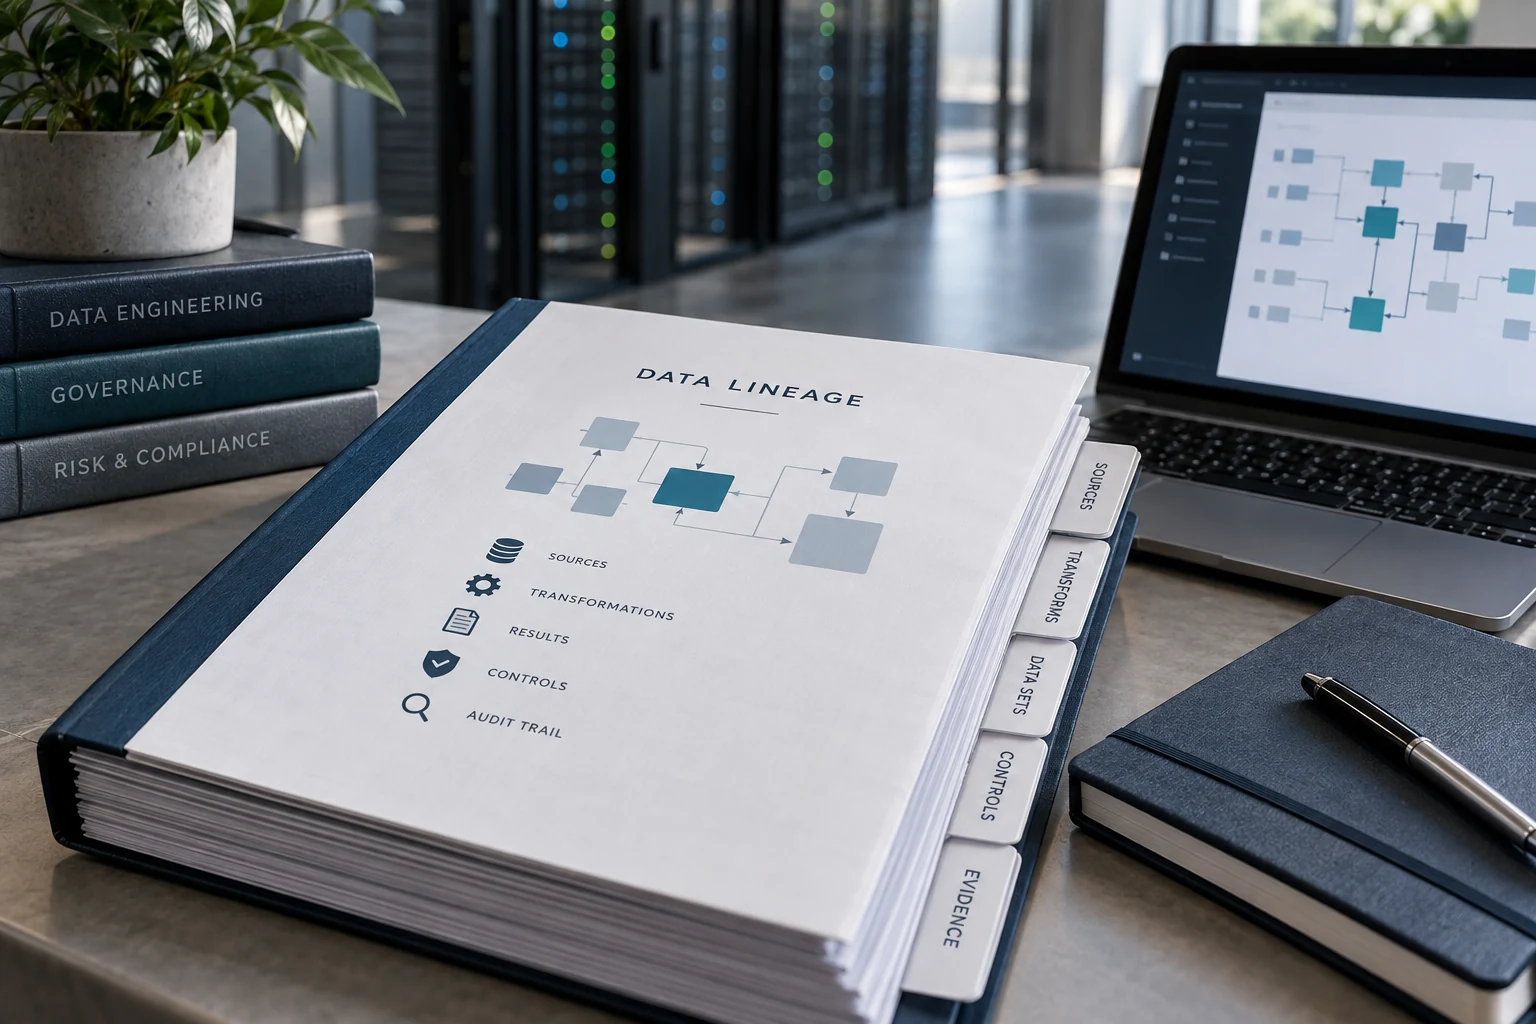

What is actually being asked has three parts. Provenance: which source records and which transformations produced this specific value. Authorization: who had the ability to change the data or the logic, and was any change approved. Integrity: how do you know nothing changed between the source and the report. A table-level graph gestures at the first and is silent on the other two, which is why a lineage tool alone rarely closes the finding it was bought to close.
You are probably here because
- A reviewer asked for the derivation of one figure and it took three people a week
- Two reports disagree and nobody can prove which one followed the documented logic
- The lineage tool shows a clean graph that stops at a table someone loads from a spreadsheet
- You cannot re-derive last quarter's number today and get last quarter's number
The first is a grain problem, the second is change control, the third is coverage, and the fourth is the one that turns a documentation exercise into an engineering project.
Choose the grain, and know what each one buys
Lineage exists at three grains and the cost difference between them is roughly an order of magnitude at each step.
Table-level lineage says this table was built from those tables. It is nearly free, it is what most catalogue tools produce by default, and for the purpose discussed here it is not sufficient. A fact table with ninety columns built from a dozen sources tells you almost nothing about one figure.
Column-level lineage says this column was computed from those columns using this expression. It is the grain that answers a real question, it is derivable by parsing the transformation logic, and it is where a programme should aim. Getting from table to column level is most of the work and most of the value.
Value-level lineage records, for an individual output row, exactly which input rows contributed. It is expensive in storage and complexity, and it is worth building only for a small number of figures where the stakes justify it. When it is needed, the practical implementation is not a general capability but a targeted one: for these fifteen reported metrics, materialize the contributing record identifiers alongside the result.
| Grain | Answers | Typical effort | Where it falls short |
|---|---|---|---|
| Table | Which datasets feed this one | Days; usually automatic | Cannot isolate a single figure or column |
| Column | Which fields and which expression produced this field | Weeks; SQL parsing plus gap-filling | Says nothing about which rows, or whether logic changed mid-period |
| Value | Which input records produced this specific number | Months, and ongoing storage | Only affordable for a chosen set of high-stakes figures |
| Change history | What changed, when, approved by whom | Weeks; version control plus access logs | Nothing, and it is the half most often missing |
Capture it automatically or it is already wrong
There are two ways to obtain lineage and only one survives contact with a working team. Declared lineage is written by people into documentation or a catalogue. It is accurate on the day it is written and decays immediately, because pipelines change on Tuesdays and documentation changes at quarter end, if then. Every mature data organization has a lineage document that describes a system as it existed at some point in the past, and no reliable way to tell how far off it now is.
Captured lineage is derived from the artifacts that actually run: parse the transformation SQL, emit events from the orchestrator when a job reads and writes datasets, read the transformation framework's own dependency graph. It is correct by construction because it is generated from the thing being described, and when it is wrong it is wrong in a way you can find and fix once.
In practice a good implementation combines three sources. Static parsing of SQL and transformation code gives column-level detail. Runtime events from the orchestrator — the open event specifications are widely supported now and worth using rather than inventing a schema — give you what actually ran, when, with which code version, which is the part that turns a diagram into evidence. Declared lineage fills the gaps that neither can reach, and every declared edge should be visibly marked as declared, with the date and the person who asserted it.
State your coverage as a number
Coverage is where credibility is won or lost, and the instinct is to avoid the topic. That instinct is exactly backwards. A programme that says column-level lineage is captured automatically for 84% of the transformations feeding the reporting layer; the remaining 16% is these named systems, and here is how each is handled is far more persuasive than one that presents a clean graph with silent holes. The first invites a specific conversation. The second collapses the moment somebody finds a hole, and takes the rest of the work down with it.
The gaps are always the same set, and they are worth naming in advance so they are not discovered by a reviewer.
Spreadsheets. Every organization has at least one figure whose journey passes through a workbook on someone's machine. This is where the chain breaks, universally, and no lineage tool will ever see it. The only real fixes are to bring the calculation into a managed pipeline, or to keep the spreadsheet as a controlled, versioned input with a recorded owner and a checked-in copy of each period's file. The second is a compromise and is far better than the pretence that the step does not exist.
Dynamic and procedural code. SQL assembled at runtime, stored procedures with control flow, notebooks. Static parsers cannot resolve these. Runtime capture partly can, which is a good argument for having both.
Vendor-managed steps. A third-party tool that transforms data inside its own boundary yields a graph edge that says data went in and data came out. Document what the vendor asserts, record that the middle is asserted rather than observed, and treat that edge as a control point.
Manual adjustments. The late journal entry, the analyst override, the reclassification agreed on a call. These are legitimate and they must be data: an adjustment table with a value, a reason, an author, a timestamp and an approval — never an edit applied in place to a number that then has no history.
How strong each piece of evidence is on its own — our rating
How much weight we would put on each artifact when asked to substantiate a figure. Judgment from repeated engagements, not a standard.
Reproducibility is the test that separates real from decorative
Here is the question that decides whether a lineage programme is worth what it cost: can you re-derive last quarter's reported number today, from source, and get last quarter's number?
Most cannot, and the reasons are structural rather than careless. Source tables were updated in place, so history was overwritten. Reference data changed — a mapping, a rate, a hierarchy — and the pipeline reads the current version. The transformation code changed and the old version, while in version control, is no longer wired to anything. Late-arriving records landed after the report was produced.
The fixes are known and each is a genuine engineering decision. Snapshot or version the tables that feed reported figures, so a run can be pointed at the state as of a date. Version reference data explicitly and pin the version used by each run. Record the code version with every run — a commit hash in the job metadata is enough and costs nothing. And publish figures as immutable, dated results rather than as a query anyone can re-run, so that what was reported is a stored fact and any later re-derivation is a comparison rather than a replacement.
That last point is where most of the pain disappears. If the reported number is a row in a results table with the run identifier, code version and input snapshot identifiers beside it, then the question "where did this come from" is a join. If the reported number is whatever a dashboard shows when you open it, the answer depends on the day you ask, and no amount of lineage tooling recovers that.
Evidence has to leave the tool
A reviewer needs an artifact: a document, with a date on it, that can be attached to a file and read next year by someone with no access to your systems. A graph in a web interface is not that, and a screenshot of a graph is worse, because it has no provenance itself. Build an export — for figure X as at date D, produce the full derivation chain, the code versions, the input snapshot identifiers, the reconciliation result and the coverage statement, as a signed, timestamped document. This is a two-week piece of work that determines whether the previous six months of lineage engineering can be used for the purpose it was funded for.
Pick one number and we will try to trace it with you.
Email one reported figure, the report it appears in and read access to the pipeline definitions, to contact@precisionfederal.com. You get back a written trace as far as we can take it, the exact point where the chain breaks, and what it would take to close it. Two business days. No charge and no meeting.
contact@precisionfederal.comThe half everyone forgets: who could have changed it
Provenance without change control answers one question out of three. The reviewer's second and third questions are about authorization and integrity, and lineage tooling has nothing to say about either.
What answers them is unglamorous and mostly already exists somewhere in the organization. Transformation logic lives in version control, so every change has an author, a timestamp, a reviewer and a link to the reason. Deployment is automated from the versioned source, so what runs is what was reviewed — a manual edit applied directly to a production job severs the entire chain, and it is worth knowing whether that is possible in your environment before someone else finds out. Write access to production data is limited and logged, and the list of people who hold it is short enough to print. Manual adjustments are data with an approver rather than edits.
None of that is a data engineering project. It is ordinary change control applied to the data platform, and it is where the answer to two of the three questions actually lives.
Reconciliation makes the chain testable
Lineage says what should have happened. Reconciliation demonstrates that it did. The two together are much stronger than either alone, and reconciliation is often the cheaper half.
Build a tie-out from the source system to the reported figure with the differences explained rather than merely tolerated. Count records at each stage and record the drops with reasons attached — filtered by rule, failed validation, deduplicated — so an unexplained drop is visible instead of absorbed. Check that totals foot and that period-over-period movements decompose into named causes. Run these as scheduled controls that produce dated results, which means that when a reviewer asks whether the pipeline was working in February, there is an artifact from February rather than a test you can run today.
The reconciliation record is frequently the most persuasive artifact in the whole package, because it is empirical. A diagram is a claim about the system. A dated reconciliation that ties to the penny is evidence about the system.
The mistakes we are called in to fix
- Table-level lineage bought to answer a column-level question, which cannot be done
- A hand-maintained diagram that described the platform accurately eighteen months ago
- A clean graph with silent gaps, which fails the moment a reviewer finds one
- Source tables updated in place, so no past figure can be re-derived
- Reference data read at current version, quietly changing historical results
- Manual adjustments applied as edits, leaving no author, reason or approval
- Lineage with no change control, answering one of the three questions
- Evidence that only exists inside a tool, with nothing exportable and dated
What it takes, and in what order
A workable first programme
Step two is the one to insist on. Three manual traces produce a specific, ranked list of what is actually broken in your environment, and that list will not match the list a tool vendor's discovery scan produces. It takes a week, it costs nothing, and it prevents the common outcome where a large programme improves coverage of the parts that were already fine.
The scoping decision that matters most is the first one. Full lineage over an entire warehouse is expensive and mostly unnecessary, because the vast majority of tables never feed anything anyone has to substantiate. Deep, complete, tested lineage over the fifty figures that appear in reporting is affordable and answers the question that was asked. Programmes that start with breadth tend to run out of budget before any single number can be traced end to end, which is the only outcome that counts.
Before you call it audit-ready
- Column-level lineage captured automatically, not declared, for the reporting layer
- Coverage measured and stated as a number, with the gaps named
- Declared edges visibly marked as declared, with a date and an owner
- Every run records its code version and its input snapshot identifiers
- Reference data versioned and pinned per run, never read at current
- Published figures stored as immutable dated results, not live queries
- Manual adjustments are rows with author, reason and approval — never edits
- Write access to production data is limited, logged and short enough to list
- Reconciliation controls run on a schedule and leave dated artifacts
- An export that produces the full derivation of one figure as a dated document
Bottom line
Lineage is bought as a diagram and needed as evidence, and the gap between those two is where the budget goes. Capture it from the artifacts that run rather than from documentation, at column grain, over a scoped set of figures that someone actually has to defend. State the coverage honestly, because a stated gap is a manageable conversation and a discovered gap discredits everything around it. Pair it with the ordinary change control that answers who could have altered this, and with reconciliation that demonstrates the pipeline did what the diagram claims. Then make it exportable, because evidence that only exists inside a tool is not evidence anyone can file.
Frequently asked questions
Rarely. The question is about a specific figure, and a table-level graph can only tell you that a table with ninety columns was built from a dozen others. Column-level lineage is the grain that answers a real question, and it is derivable by parsing your transformation code. Value-level lineage, which records the contributing input rows for an individual output, is expensive enough that it should be built only for a small set of high-stakes figures.
Captured, from the artifacts that actually run — parsed transformation code, plus runtime events from the orchestrator recording what ran with which code version. Documented lineage is accurate the day it is written and decays from then on, because pipelines change continuously and documents change at quarter end. Where a gap can only be filled by a human assertion, mark that edge as declared with the date and the person who asserted it, so an asserted edge is never mistaken for an observed one.
Complete coverage of a whole estate is not achievable, and chasing it is the wrong goal. What is achievable is high coverage of a scoped set — the transformations feeding the figures that must be substantiated — with the remainder named specifically: spreadsheets, dynamic SQL, vendor-managed steps and manual adjustments. A stated coverage number with named gaps is far more credible than a clean-looking graph with silent ones, and it is what turns the conversation into a plan.
Usually four causes, and they compound: source tables were updated in place so history is gone, reference data is read at its current version, the transformation code changed and the old version is no longer wired to anything, and late-arriving records landed after the report was produced. The fixes are snapshots or versioned tables, explicitly pinned reference data, a recorded code version per run, and publishing figures as immutable dated results rather than as a query anyone can re-run.
It gives you a starting point and usually the shallowest grain. Catalogues are good at discovery, ownership and table-level relationships. Turning that into evidence requires column-level parsing, runtime capture with code versions, snapshotting so a past figure can be re-derived, change control over who can alter logic and data, dated reconciliation results, and an export that produces a document rather than a screen. The catalogue is one component of that, not the whole of it.